Day 72: the split server times its own read and says if it paid
Date: 2026-09-30 · Week 14 · Phase 5 Benchmark and optimize
What I added today
Yesterday’s “Tomorrow” was a timing. Day 71’s probe tells a split server that both passes are correct on the card it boots on. It says nothing about whether they are worth it. The split read exists to shorten the longest program in a decode launch, and SplitPlan.wave_speedup predicts how much from tile counts alone. Now the boot measures it too, and /health carries both numbers side by side.
flash_decoding.py. Two additions:
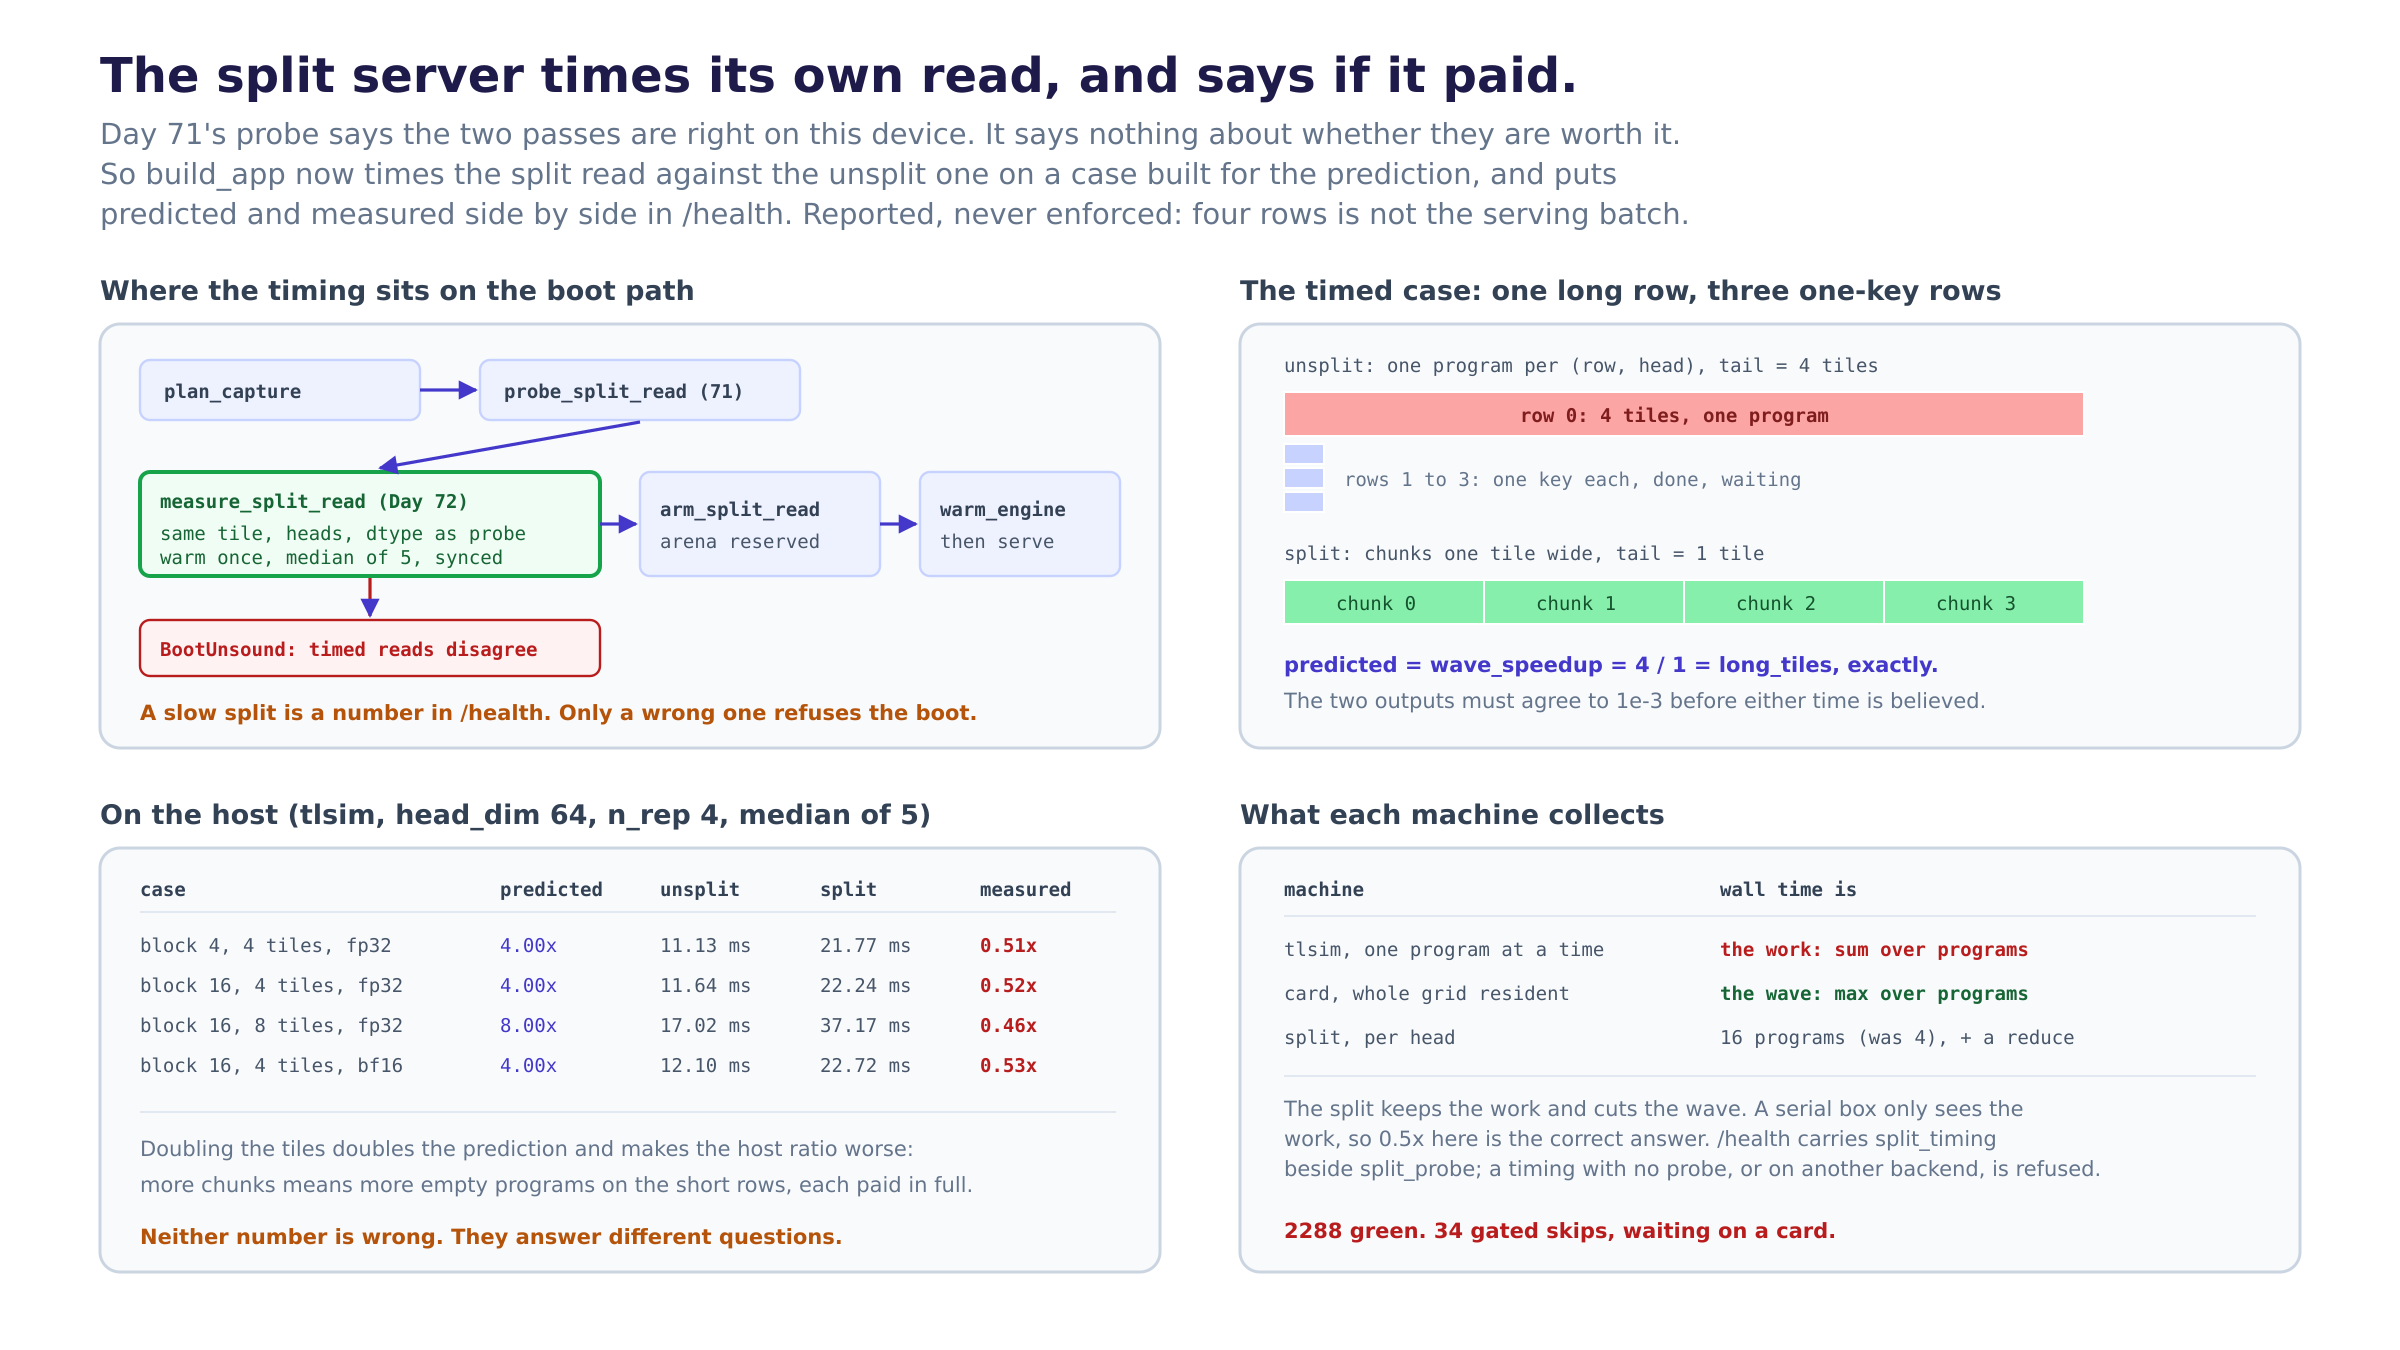
time_split_read(device, block, head_dim, n_rep, dtype, long_tiles, short_rows, repeats)builds the case the prediction is about: one rowlong_tiles * blockkeys long,short_rowsrows of one key, cut into chunks one tile wide. Unsplit, the long row’s programs walklong_tilestiles; split, nothing walks more than one, sowave_speedupis exactlylong_tiles. It checks the two reads agree toPROBE_ATOL, gives each one untimed warm call, then timesrepeatscalls of each, alternating, synchronised, and keeps the median.SplitTiming, the report: backend, geometry, both tails,predicted,unsplit_ms,split_ms, and the derivedmeasured(unsplit over split, the same way round aspredicted) andpays.
The probe’s case wasn’t reused. Its long row is three tiles of a block, which is short enough that launch overhead is the only thing a clock would see.
launch.py. measure_split_read(engine) runs the timing with the read’s tile, the model’s head_dim and GQA factor, and the weights’ dtype, the same four numbers the probe takes and for the same reason. build_app calls it after the probe and before the arena. The report goes on app.state.split_timing and into /health as split_timing. check_boot_info refuses a payload that times a read nobody graded (a split_timing with no split_probe) and one that timed one backend and graded another.
tests/test_split_timing.py. 19 new tests run here and 1 more is GPU-gated. The timing tests plant a fake clock and wrap both reads so each call charges a fixed cost while the honest attention still runs. That’s how the median, the warm call and the ratio are pinned exactly. Suite 2288 green (34 GPU-gated skips), ruff clean.
The timing on the host (tlsim, head_dim 64, n_rep 4, median of 5):
case                         predicted   unsplit    split   measured
block 4, 4 tiles, fp32           4.00x  11.13 ms 21.77 ms     0.51x
block 16, 4 tiles, fp32          4.00x  11.64 ms 22.24 ms     0.52x
block 16, 8 tiles, fp32          8.00x  17.02 ms 37.17 ms     0.46x
block 16, 4 tiles, bf16          4.00x  12.10 ms 22.72 ms     0.53x
Why it matters
Only a card can test the prediction. wave_speedup is a claim about a grid whose programs are all resident at once, so the slowest one sets the time. That’s a property of the device, and until today nothing on the boot path asked the device. Now the first --split-read boot on a rented card says “predicted 4x, measured Nx” in its health check, and the gap between them is the first real number this phase has produced about the split.
It’s reported, not enforced. The timed case is four rows and a serving batch is sixty-four. A split that loses on the small case can still win on the big one, so refusing a boot on this number would refuse it on the wrong batch. The one refusal is the two timed reads disagreeing, because a fast wrong answer isn’t a speedup and the probe graded a different case.
Time the kernel that serves. Same constexpr argument as Day 71: BLOCK_N, HEAD_DIM and N_REP each pick a different compiled kernel, so the timing takes them from the engine. The warm call is untimed because on a card it’s the Triton compile, seconds once per process, and timing it would grade the compiler.
What I learned
- A serial backend collects the work and never the wave. tlsim runs one program at a time, so its wall time is the sum over programs, and the split doesn’t reduce that sum: it walks the same tiles, then launches 16 programs per head where the unsplit read launched 4, most of them empty, then runs a reduce on top. Predicted 4x, measured 0.5x. Neither number is wrong. They answer different questions, and this box can only answer one of them.
- The ratio gets worse as the prediction gets better. Going from 4 tiles to 8 doubles the predicted speedup and drops the host ratio from 0.52 to 0.46, because more chunks means more empty programs on the short rows. On a card those idle programs are nearly free. On a serial machine each one costs a full program’s overhead. That’s
idle_fractionfrom Day 63 showing up as wall time. - Fake the clock, not the read. Planting a cost per call while the real attention still runs means the agreement check, the warm call and the median are all tested against real outputs with exact timings. Faking the reads would have tested a timer around nothing.
- A sync on each side of the clock, not just one. A CUDA launch returns as soon as it’s queued. Without a sync before
start, the previous call’s kernel gets billed to this one. Without one before the stop, the call looks like it took microseconds.
Diagram
split-boot-timing.png. Top left: where the timing sits on the boot path, between the probe and the arena. Top right: the timed case, unsplit and split, and why the predicted wave is exactly long_tiles. Bottom left: the host numbers. Bottom right: what a serial backend and a resident grid each collect.
Tomorrow
The probe and the timing both live in /health, and the bench scripts don’t read either one. graphbench.py runs three arms and prints its own table. The next step is for its split arm to pull split_probe and split_timing off the server it booted and print them under the arm’s row, so the first card run puts “graded on triton, predicted 4x, measured Nx” in the same table as the throughput it bought.
The hardware caveat hasn’t changed: graphbench.py --weights ./weights --device cuda --rates 1,2,4,8 on all three arms, with prompts past 514 tokens, is still the first run to book. Read split_timing.measured off /health next to split_probe.backend.
Post angle
Day 72 of building an LLM inference engine from scratch. My flash-decoding plan predicts a 4x shorter tail from tile counts alone. That’s a claim about a GPU where every program runs at once. So the split server now times both reads at boot and puts the predicted and measured numbers side by side in /health. On my CPU simulator it measures 0.5x, and that’s correct: a serial machine pays for every tile and every empty chunk, so it gets the work and never the wave. vLLM and SGLang ship the split; I’m learning to make it report what it actually buys on the card it runs on. 2288 green.