Day 60: the read becomes a choice, and a counter is what can see it
Date: 2026-09-16 · Week 14 · Phase 5 Benchmark and optimize
What I added today
nanoserve.reads, and the flag that reaches it from a command line.
Day 59 wrote paged_attention_batched_kernel, proved it equal to the oracle on toy pools, and stopped. Nothing called it, so every decode step in the engine still went through the read that gathers the whole [rows, max_ctx] mapping and scores it into a [rows, heads, 1, ctx] rectangle. Today is the wiring, and the wiring turned out to be four lines of it and a day of the question those four lines open.
PagedRead holds the mode, the tile width and the dispatch. BatchedPagedKVCache owns one instead of naming a function, and both arms of paged_attention go through it: the planned arm with validated=True and the gathered arm with its context_bounds, unchanged, because a dispatch that softened one branch’s guard would make the two reads differ in what they accept rather than in what they hold. streamed_read and read_block thread through Engine.build, build_engine and build_app unbundled, and serve.py gains --streamed-read and --read-block. Nothing bundles it, unlike Day 56’s three and Day 58’s fourth.
ReadStats is the reading: mode, block, calls, rows, score_cells, held_cells, with since for a window and saving for the quotient. The engine publishes it under paged_read in /health on every launch, and graphbench.py learns read_from_health, two more fields on ArmReport and check_arm_read.
tests/test_reads.py is 40 tests including two live servers. Suite 1898 green (5 GPU-gated skips), ruff clean.
wirebench.py, host only, no weights (day-60-wirebench.csv):
the wired decode read, one tiny engine, both reads:

 rows  prompt  steps  block  same  reads   charged     held  saving  ms/read  vs rect
    2      16     48      8   yes     94     48128    12032    4.0x     13.84     19.9x
    2      16     48     32   yes     94     48128    39296    1.2x      5.90      8.5x
    2      16     48      -     -     94     48128    48128    1.0x      0.70      1.0x
    4      16     48      8   yes     94    120320    24064    5.0x     28.25     36.7x
    4      16     48     32   yes     94    120320    88576    1.4x     11.67     15.2x
    4      16     48      -     -     94    120320   120320    1.0x      0.77      1.0x
    8      16     48      8   yes     94    240640    48128    5.0x     55.57     67.1x
    8      16     48     32   yes     94    240640   177152    1.4x     22.68     27.4x
    8      16     48      -     -     94    240640   240640    1.0x      0.83      1.0x
Why it matters
The flag has no witness downstream of itself, and that is the day’s actual problem. I expected the hard part to be the read. It was not: the kernel was already right and the call sites were two. The hard part is that a server launched with --streamed-read and a server launched without it return the same tokens, the same finish_reason, the same token counts, the same pool audit and the same latency shape. If the flag silently fails to reach the cache, every test in the repo still passes and every client still gets the right answer. There is no output to assert on, because the whole claim is that there is no output to assert on. So the process has to publish which read it ran, and the counters are not instrumentation added afterwards, they are the only thing that makes the wiring testable at all.
Both cell counts come from shapes, and the counter I wanted was the one I could not afford. The interesting number is tiles walked, which is cdiv over context_lens, and reaching those on a card is int(tensor) once per call per layer: exactly the synchronisation Day 48 found the hard way and the graph break Day 49 spent a day removing. q.shape and slot_mapping.shape are static, so score_cells and streamed_score_cells are host arithmetic over numbers the caller already holds, and the read charges itself for nothing it had to look at. A counter that costs a sync moves the thing it is measuring, and it would have moved it in precisely the phase whose whole subject is launch overhead.
1.0x is a measurement and I nearly made it a None. The default read holds every cell it is charged, so its saving is exactly one, and the first version of saving returned 0.0 when there was nothing to divide, matching CaptureStats.replay_share. That is the wrong analogy. A replay share of zero means “no replays happened”; a saving of one means “this read held what it was charged”, which is a fact about the rectangle and not an absence of data. Reporting the default configuration as unmeasured would make the two arms of every comparison in this file incomparable.
The acceptance claim has to be downstream of the sampler, and 1e-5 is why. Every other test compares tensors with allclose. A read that agrees to 1e-5 can still put a different token on the wire: the sampler takes an argmax over logits that came out of this attention, and two floats a ulp apart on either side of a tie choose different words, and then different continuations forever. So the test that settles it is two uvicorns, six clients over four slots, one flag between them, and the comparison is the text a client received after prefill, decode, sampling, detokenisation and SSE framing. Same bytes on both arms, with sampled requests in the crowd as well as greedy ones.
The measured saving is below the arithmetic one, and the reason is honest. Day 59 proved the ratio is context_width / block exactly. The table above says 5.0x at a block of 8, not 8x, because a decode run’s width grows: the first step reads a 16-token context and the last reads 64, and the saving is the ratio of two sums over the whole run rather than the ratio at any one shape. The arithmetic result is the saving at the widest step, which is the step the capture pool is sized by, so it is still the right number for the memory decision. It is not the number a whole run averages, and quoting one for the other would be the kind of over-claim this log exists to avoid.
The default stays off, and the last column is why. 13 to 55 ms per read against 0.7 to 0.8: 8x to 67x slower, on the same tiny model. The loop is tlsim in Python, one program per (row, head) executed serially on a CPU, so the slowdown grows with the batch, which is the opposite of what the same kernel does on a card. Nothing about that is a surprise and nothing about it is fixable here. It is the reason streamed_read=False is the default in four separate places and the reason no other flag turns it on: --cuda-graphs bundles three switches because an operator asking for CUDA graphs means all three, and nobody asking for CUDA graphs is asking to trade somebody’s latency for a memory saving they did not request.
What I learned
- A wiring day needs a witness before it needs a test. I wrote the correctness tests first, out of habit, and they all passed the moment the dispatch existed. Then I realised none of them would have failed if I had wired the flag to the gathered arm of
paged_attentionand not the planned one, which is the arm a served decode step actually takes. The test that catches that is a counter read twice, and I would not have written it if the day had only been about agreement. - “Publish nothing when it is off” and “always publish” are both right, for different things.
CaptureStatsis absent from/healthwhen the capture is off, and that absence is load-bearing: it is howcapture_from_healthtells “switched off” from “switched on and broken”. I copied that shape for the read and then undid it. A read is not optional. Every decode step runs one, so a missing section has no configuration it could legitimately mean, andread_from_healthrefuses rather than defaulting. Defaulting would let an arm pass a gate about a read it never observed, which is the one failure a benchmark must not have. sincewanted a refusal I did not plan for. Two readings that disagree about the mode are two processes, or one payload parsed wrong. Subtracting them produces a perfectly plausible window over nothing, with a saving computed from one read’s numerator and another’s denominator. The mode check is three lines and it is the only thing standing between that and a number in a table.- The counters go on the read, not on the cache. My first sketch had
callsandheld_cellsas attributes ofBatchedPagedKVCache, which is where the call site is. That is wrong for the same reasonRowCompactoris not three ints on the scheduler: the thing being counted is the read’s behaviour, and a cache that carried the tally would make swapping the read a change in two places.PagedReadis an object rather than a function precisely because it has to remember. DecodeShapeis where the second copy of the multiplication did not go.rows * heads * query_len * widthis a one-liner and I wrote it inline before deleting it.score_cellsis Day 54’s definition, and the capture list sizes its shared pool with it. A second copy in the read would be a second copy that can drift, and the symptom would be a server reporting a saving against a rectangle that is not the rectangle the pool was reserved for.- The first draft of the acceptance load was too short to be a crowd, and the gate said so in the right words.
check_arm_was_crowdedrefused withpeak_runningof 0, which is Day 41’s distinction between “served one at a time” and “finished between two polls of the watcher”. Four clients at six tokens is the second. It is a small thing, but it is the third time a gate written for one day has caught a different day’s mistake, and each time the message named the fix. - This is the fifth flag and the first that changes the arithmetic. Bucketing, persistent inputs, the capture and compaction all leave the computed answer alone: they change the shape a step presents, where its tensors live, how it is launched and which row it sits in. This one changes what the forward computes, to a few ulps. That is why it gets a socket-level acceptance test and the other four got counters, and it is a distinction I had not drawn before today.
Diagram
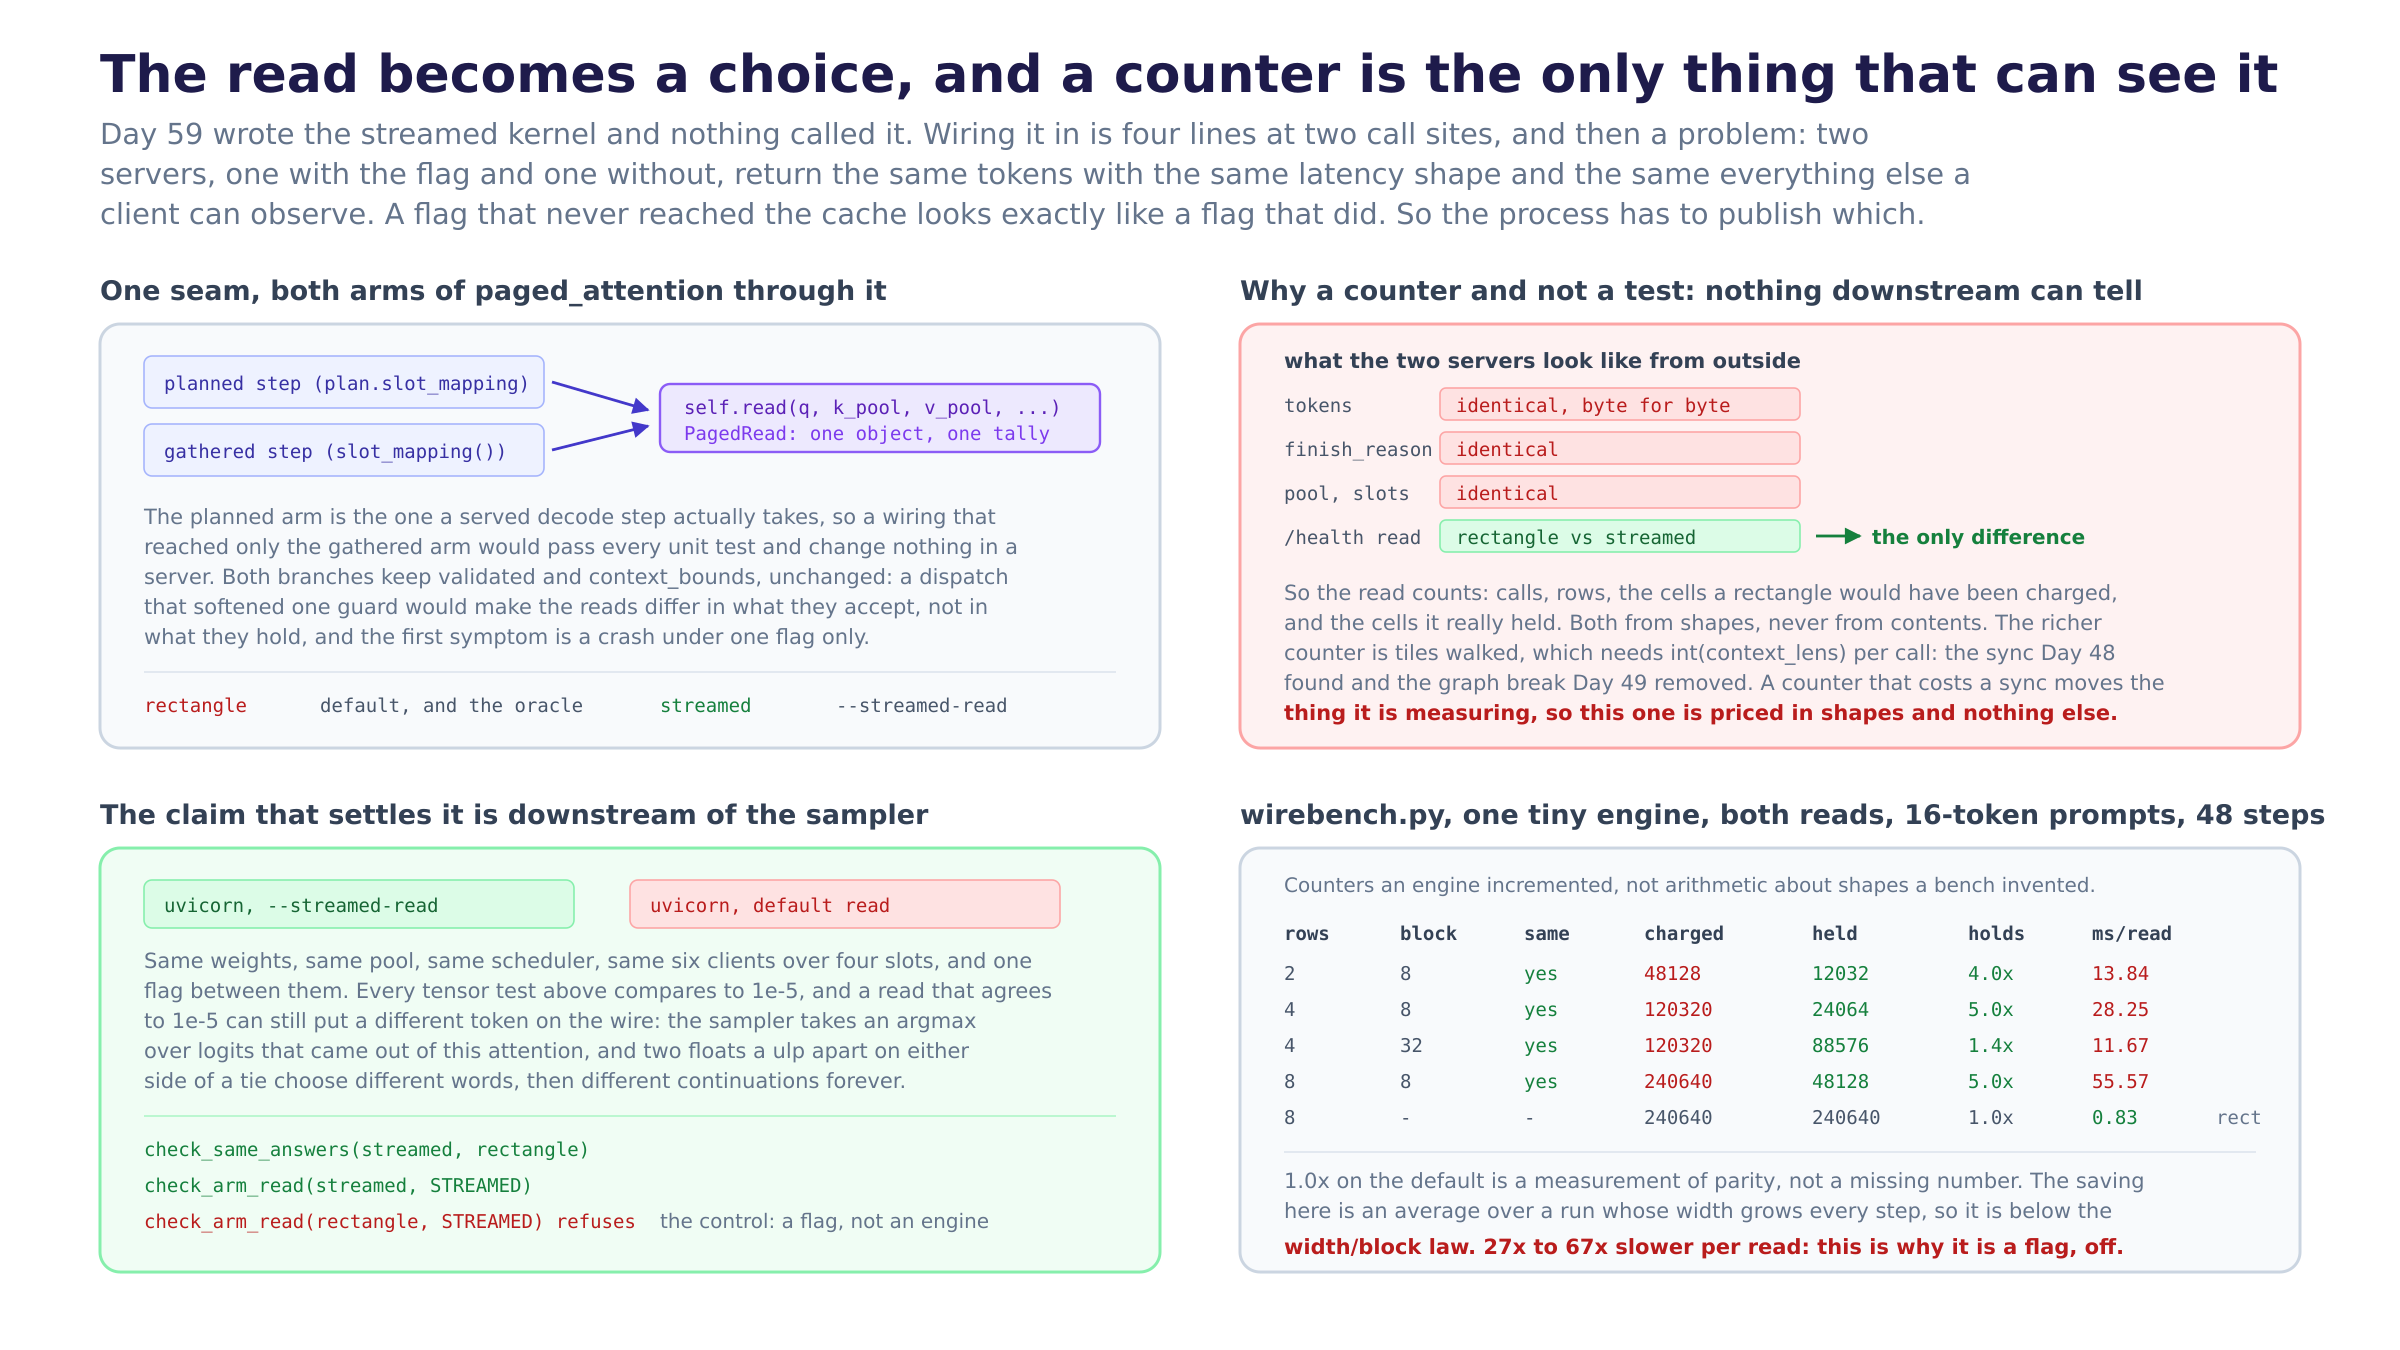
read-is-a-choice.png. Left top is the seam: both arms of paged_attention through one PagedRead, with the refusals kept on both branches. Right top is why the counter exists: four things about the two servers that are identical from outside and the one that is not. Left bottom is the acceptance run, two uvicorns and one flag, and the control that refuses. Right bottom is the measured table with the rectangle’s 1.0x row left in.
Tomorrow
The read has no width axis and the capture list still has two. That is Day 59’s real prize and it is now unblocked: DecodeBuckets buckets the width because workspace_bytes grows with it, and with the streamed read the widest thing alive is a tile the caller picked, so the shape a decode step has to present is rows and nothing else. Day 61 is DecodeBuckets(streamed=True) losing an axis, the capture list going from 36 shapes to 6, and the three things that fall out of it: a smaller shared pool, a shorter warm-up and a plan_capture whose budget stops being the binding constraint. The honest caveat is unchanged and now has a number next to it: none of this is fast until the loop is Triton, the wired read is 8x to 67x slower per call on this box, and the CUDA run Day 58 pointed at is still first in the queue on hardware.
Post angle
Day 60 of building an LLM inference engine from scratch. Yesterday I wrote a decode read that never builds the [rows, heads, 1, ctx] score rectangle, proved it equal to the old one, and then noticed nothing called it. So today was the wiring, and the wiring was four lines at two call sites and then a problem I did not see coming: the flag has no witness. A server launched with --streamed-read and one launched without it return the same tokens, the same finish reasons, the same token counts, the same pool audit and the same latency curve. If the flag silently fails to reach the cache, every test in the repo still passes and every client still gets the right answer. There is nothing downstream to assert on, because the entire claim is that there is nothing downstream to assert on. So the read counts what it did, and /health publishes it: calls, rows, the score cells a rectangle read would have been charged, and the cells this read actually held. The counter I wanted was tiles walked, and I could not have it: that needs int(context_lens) per call per layer, which is the device sync I spent Day 48 finding and the graph break I spent Day 49 removing. A counter that costs a sync moves the thing it is measuring. Shapes are free, so the accounting is priced in shapes. The test that actually settles the day is two uvicorns with six clients each and one flag between them, comparing the text a client received. That has to be downstream of the sampler: the tensors agree to 1e-5, and a read that agrees to 1e-5 can still put a different token on the wire, because argmax over two floats a ulp apart on either side of a tie picks a different word and then a different continuation forever. Same bytes on both arms. And the default is off, which the measurement earns: the streamed loop is tlsim in Python, one program per (row, head) run serially, so it is 8x to 67x slower per read than the torch path on this box. Correct, much smaller, and not fast until it is Triton. 1898 green.