Day 46: one decode step, taken apart, and the two clocks in it
Date: 2026-08-28 · Week 13 · Phase 5 Benchmark and optimize
What I added today
nanoserve.profiler, which opens Week 13 by looking inside a step for the first time: Phase for one named region and the two times it owns, StepSample for one iteration of the loop, StepProfile with phase_totals, hotspots, bound, idle_fraction and overhead_per_token_s, amdahl and step_time_under and speedup_if for pricing an optimisation before doing it, recommended_model for choosing between the two overlap models by reading the code rather than by taste, loop_overhead_s and step_with_compute for the part of this that survives having no accelerator, four gates (check_warmed_up, check_accounted, check_attributable, check_device_timed), bar and render for the step as a table, project_point as the bridge back to Day 45’s curve, and StepRecorder plus NULL_RECORDER for collecting it from a live loop. Engine.step now carries a recorder and names its six phases inline, so there is one copy of the loop rather than a profiling copy that drifts. profbench.py at the root drives real weights through it and writes day-46-profbench.csv. tests/test_profiler.py is 119 tests: four tiers of arithmetic and gates, then the recorder on a clock the test advances by hand, then the real engine loop. One checks Amdahl’s law against its closed form and six profile an actual engine. Suite 1030 green (5 GPU-gated skips), ruff clean.
Llama-3.2-1B, cpu fp32, 4 requests x 12 tokens, 2 warmup steps dropped, decode steps only:
slots     step     forward      loop   loop/token   loop share
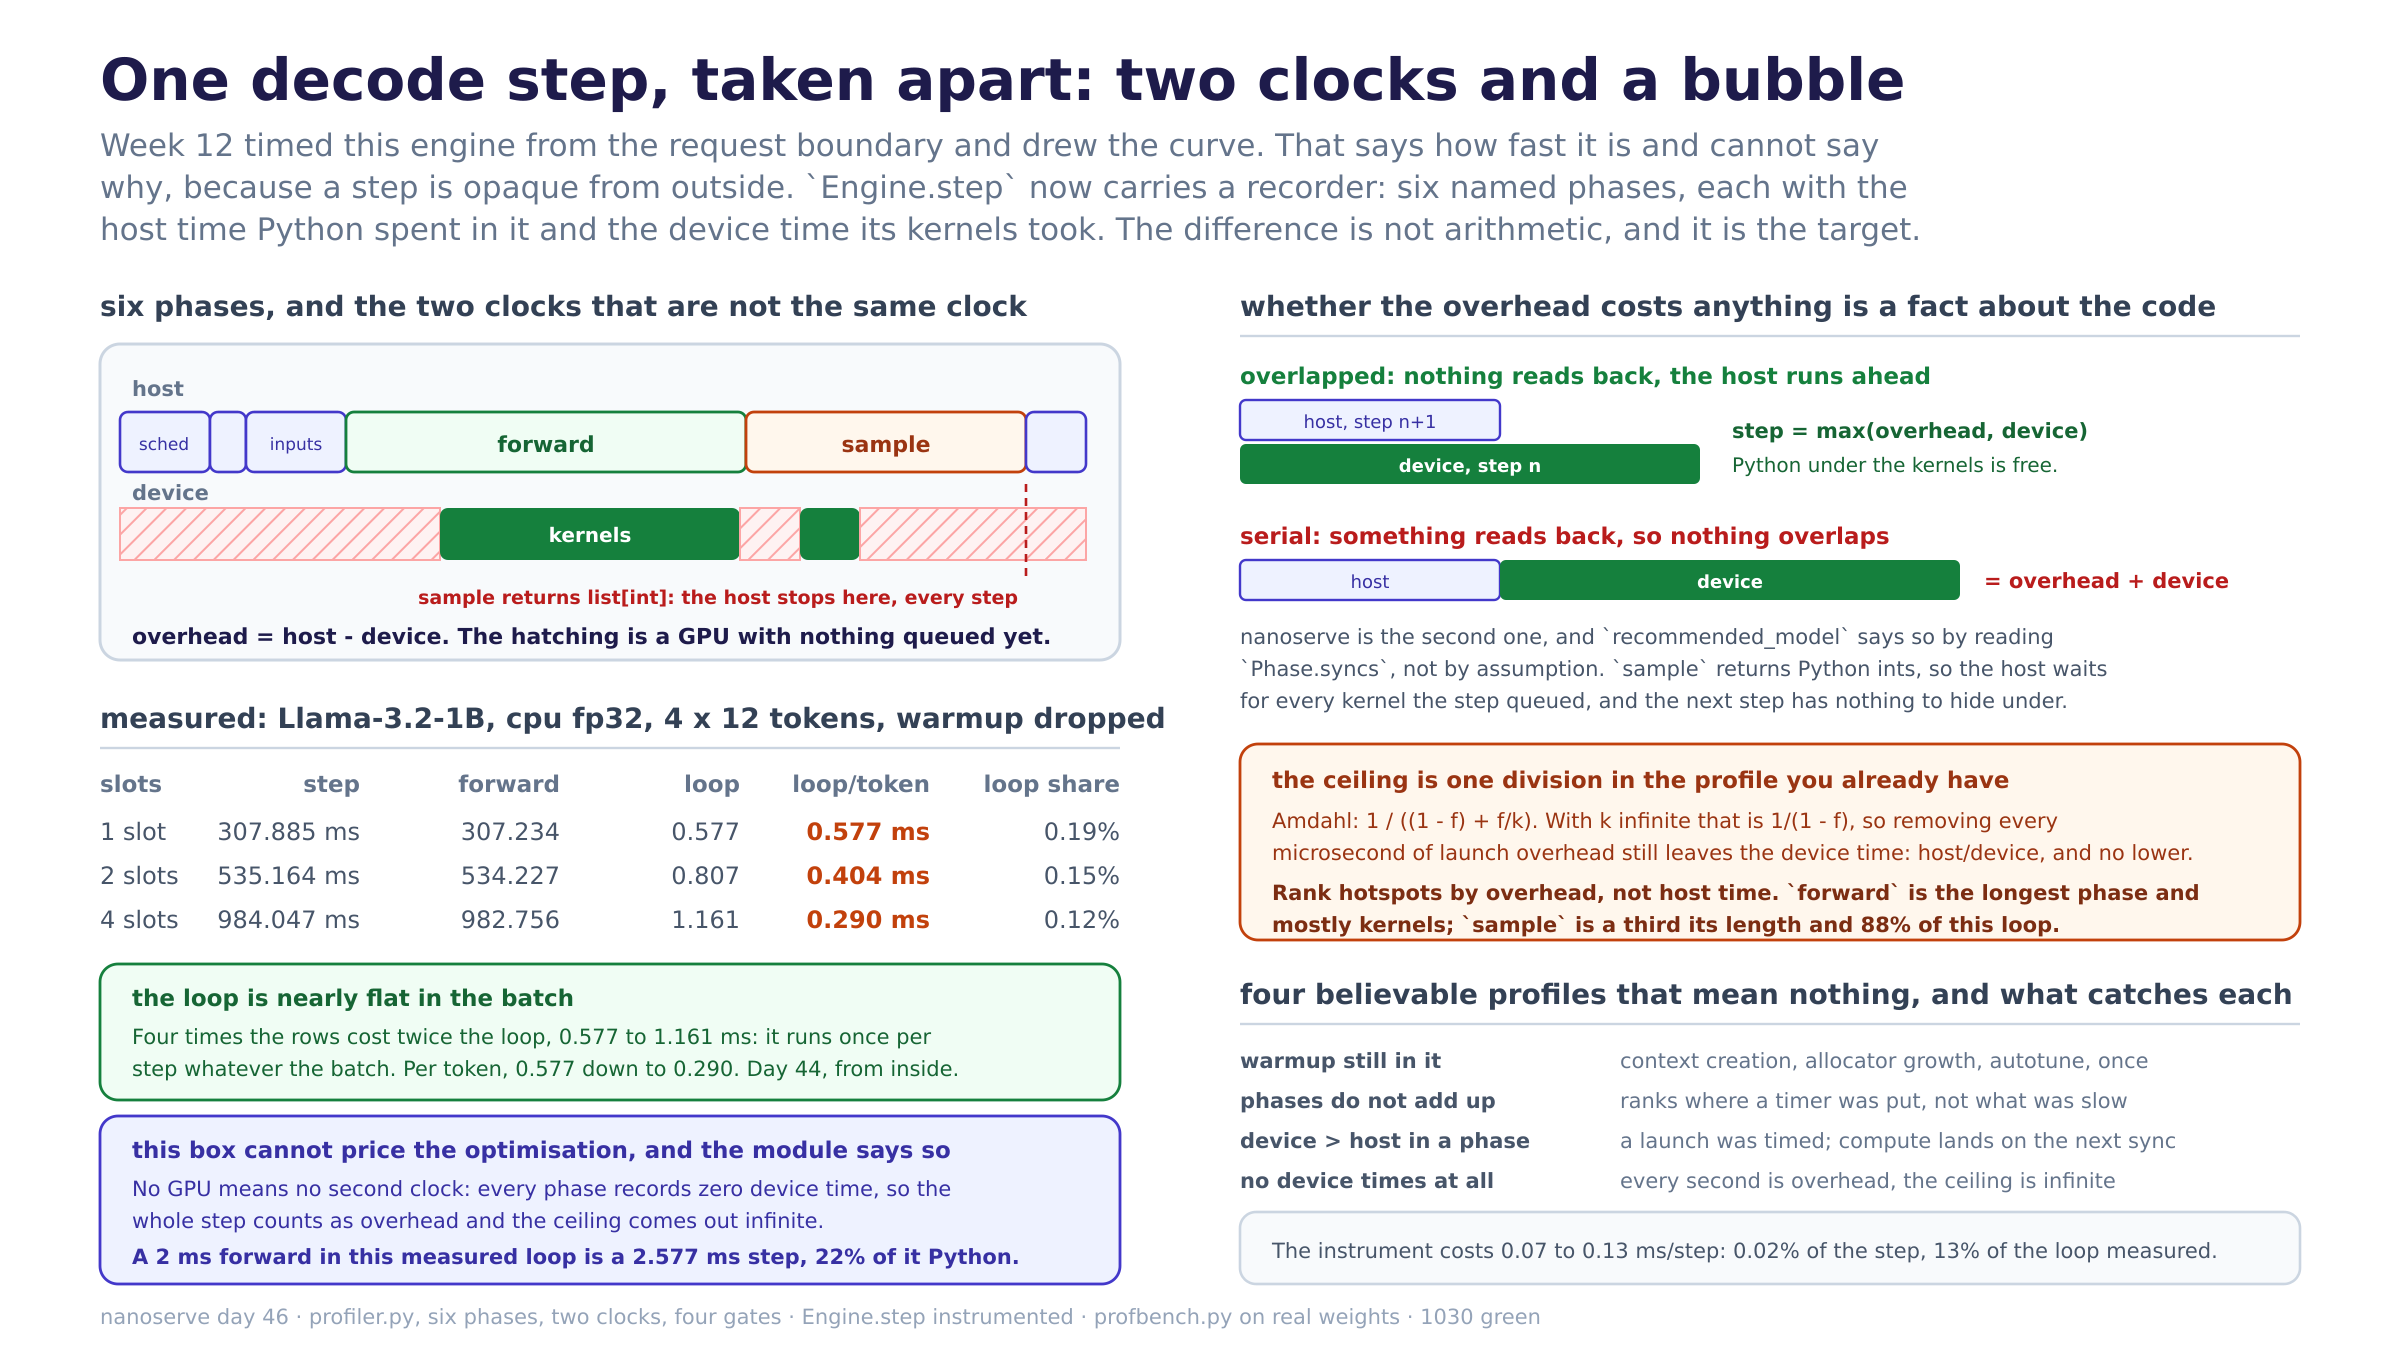
1     307.885ms   307.234ms   0.577ms     0.577ms        0.19%
2     535.164ms   534.227ms   0.807ms     0.404ms        0.15%
4     984.047ms   982.756ms   1.161ms     0.290ms        0.12%
The loop is schedule + sync_rows + build_inputs + sample + collect, and sample is 0.505ms, 0.697ms and 1.029ms of it: 86% to 89% of the loop at every batch.
Why it matters
Host time and device time are two different measurements of the same step, and almost everything this week depends on keeping them apart. A phase’s host time is how long Python was inside it. Its device time is how long the GPU spent on the kernels it launched. The difference is the overhead, and it is not a rounding error on a small model: a decode step at batch 4 is a handful of small matmuls on one token per row, while the host has to run a scheduler, walk block tables, build two tensors, dispatch a few hundred aten ops and read a token back per row. That difference is exactly what torch.compile and CUDA graph capture attack, and it is exactly what a faster card does not.
Which means the ceiling on this week’s work is one division, available before any of it is done. Removing every microsecond of launch overhead leaves the device time, so the best possible step is device and the speedup is host / device. That is Amdahl’s law with k infinite and f equal to idle_fraction, and speedup_if(profile, overhead_factor=inf) and amdahl(profile.idle_fraction, inf) are the same number by two routes, which the suite asserts. If a profile says 1.1x, the week is over before it starts and the problem is somewhere else.
Whether the overhead costs anything at all is a fact about the code, not a modelling assumption. CUDA launches are asynchronous, so if nothing in the step reads a device tensor back, the host runs ahead and the step is max(overhead, device): Python that fits under the kernels is free. If something does read back, the host blocks and the step is overhead + device. Both models are in the module and the choice between them is made by recommended_model, which reads Phase.syncs. nanoserve is the serial one and will be until the output handling moves off the critical path: _sample returns list[int], so every decode step drags tokens across the bus and waits, and the next step’s launch overhead has nothing to hide under. check_model_applies refuses the flattering model rather than leaving it available.
Ranking hotspots by host time sends you to optimise the wrong thing. forward is the longest phase in every profile I have and is mostly device work no Python change reaches. sample is a third of its length and nearly all host. So hotspots() ranks by overhead, not by host time: the question a profile is asked is not “where did the seconds go” but “which of them could go away”.
The four gates are four believable profiles that mean nothing. One that still contains its first step is measuring context creation, allocator growth and autotuning. One whose phases do not add up to its steps ranks the places somebody put a timer. One whose host timings were taken around async launches records launch cost and charges the real compute to whatever synchronises next, which is how a forward comes out at 0.1ms and an argmax at 30ms. And one with no device times at all makes every second “overhead”, idle_fraction 1.0 and the ceiling infinite. All four render a clean table.
What I learned
- On this box the loop is 0.19% of a step, and that number is the reason the whole module has a
check_device_timed. The CPU forward is 307ms and the entire Python loop around it is 0.577ms. If I reported “99.8% of the removable time is inforward” I would be right and useless, because on CPU there is no second clock: the matmuls run on the same core as the interpreter, so the split does not exist andspeedup_if(overhead_factor=inf)comes out infinite. The gate refuses that outright. It is the first time I have written a check whose job is to stop my own box from answering a question it cannot. - The measurement that survives is separating the loop from the arithmetic by name, not by clock.
schedule,sync_rows,build_inputs,sampleandcollectare the same host work whatever the forward runs on;forwardis the part a device makes faster. Soloop_overhead_sis a number a CPU can measure honestly, andstep_with_computesubstitutes a GPU-sized forward into it: 2ms of arithmetic under this measured loop is a 2.577ms step with 22% of it Python. That is a projection and is labelled as one, and it is a much better estimate than scaling the whole CPU step down, which is the estimate that gets made by default and is wrong in the direction that hides the problem. - The projection is only legitimate down one column, and I nearly drew it across the sweep. Holding the forward at 2ms while sweeping the slots says the loop share climbs 22% to 29% to 37%, which looks like a finding and is an artefact: a batch-4 forward is not a batch-1 forward, so the same 2ms cannot stand for both. The number that is comparable across the sweep is loop per token, and it falls 0.577 to 0.404 to 0.290. Same three profiles, one reading that means something and one that does not, separated only by which quantity I held fixed.
- Four times the rows cost twice the loop, and that is the whole mechanism of batching seen from the inside. 0.577ms to 1.161ms while the batch went 1 to 4. The loop runs once per step no matter how many rows are in it, so its per-token cost falls like 1/B while the arithmetic per token stays flat. Day 44 measured the consequence from outside (each doubling of the slots bought less than a doubling of throughput) and Day 45 drew it. This is the constant that produces it, in milliseconds, with a name.
- The loop is not perfectly flat, and the part that grows is the part that syncs.
sampleis 0.505ms, 0.697ms, 1.029ms across the sweep, which is 86% to 89% of the loop at every batch and the only phase that grows with the rows in any serious way (schedulegoes 0.027 to 0.048,collect0.011 to 0.023). It grows because it is per-row work with a device readback in it, not because sampling is expensive. That is the same phasesyncs=Trueis set on, so the phase that costs the most host time is also the phase that stops the host running ahead. One line of code is doing both. - The instrument costs 0.07 to 0.13ms per step, which is 13% of the thing it is measuring. That is the gap
check_accountedreads: the phases account for 99.98% of the step, and the missing sliver is the recorder’s own dataclass construction and context-manager machinery. Against a 307ms step it is nothing. Against a 0.577ms loop it is a real fraction, and it is whyNullRecorderis written as__enter__/__exit__classes with__slots__rather thancontextlib.nullcontext: the engine enters seven of these per step whether anybody is profiling or not, and this is the week to stop being casual about microseconds. - Timing a phase on CUDA correctly requires making the step slower, and there is no way around it.
CudaDeviceTimer.stopsynchronises, because the elapsed time between two events is not readable until the second one has happened. Without the wait, the host clock around a region returns a launch time while the device clock returns a compute time, and subtracting them gives a negative overhead, which is whatPhase.hiddenandcheck_attributabledetect. So a profiled step is a serialised step, its total is longer than the uninstrumented one, and the shape is the thing to trust rather than the number. That is a real limitation of this design, not a bug in it, and the alternative (an unsynced run for the total and a synced run for the attribution) is two runs. prefillhas a sync I did not know about until the phases were named. The accounting lineint(batch.lengths.sum().item())reads a device tensor every prefill step purely to add to a counter that nothing time-critical reads. It has been there since Day 27 and it is invisible in the code. Giving it a phase calledaccountwithsyncs=Truemade it a row in a table, which is a decent argument for instrumenting a loop even before you optimise it.
Diagram
step-profile.png. Left top is one decode step as two rows, the six host phases above and the device below with the idle stretches hatched, and the readback that ends it marked. Left bottom is the measured sweep and what it can and cannot say without a device. Right top is the two overlap models drawn as timelines, right middle is the ceiling and why hotspots rank by overhead, and right bottom is the four gates plus what the instrument itself costs.
Tomorrow
The profile exists and says the loop is 0.577ms at one row and 88% of it is the token readback. Day 47 goes after that phase specifically: sampling that stays on the device and hands tokens back in one transfer, or none at all until a stop condition needs checking, with speedup_if(eliminate=("sample",)) as the number to beat and check_accounted as the thing that stops me moving the cost somewhere I am not looking. torch.compile on the decode step is the day after, once the readback is not the first thing it would have to work around.
Post angle
Day 46 of building an LLM inference engine from scratch. I put a stopwatch inside one decode step for the first time, and the useful thing was not the total, it was that a step has two clocks in it and they are not the same clock. Host time is how long Python was in a phase. Device time is how long the GPU spent on the kernels that phase launched. The difference is a bubble: the GPU idle because Python had not told it anything yet. That difference is exactly what torch.compile and CUDA graph capture attack and exactly what a faster card does not, which means the ceiling on the whole optimisation is host / device, one division, available from a profile you already have. Then the part I did not expect: whether that overhead costs anything is a fact about your code, not a modelling choice. Launches are async, so Python that fits under the kernels is free, and the step is max(overhead, device). Unless something reads a device tensor back, in which case the host blocks and it is overhead + device. Mine reads back: sampling returns Python ints every step, so nothing overlaps. The module decides which model applies by reading a flag on the phases rather than letting me choose the flattering one. Three findings. Ranking hotspots by host time sends you to optimise a matmul; ranked by overhead the answer is the token readback, which is a third the length and 88% of my loop. Four times the rows cost twice the loop, so per token it falls 0.577ms to 0.290ms, which is batching’s whole mechanism seen from the inside. And my box has no GPU, so every phase records zero device time and the ceiling comes out infinite, which is not a ceiling but a missing measurement wearing one, so there is a gate that refuses to price anything from it. 1030 green.