Day 13: the cache as a curve, not a number, and a benchmark that checks itself
Date: 2026-06-28 · Week 3 · Phase 1 Correct generation
What I added today
src/nanoserve/benchmark.py: a stdlib-only, model-free timing core (RunTiming, measure_stream, measure_call, speedup) with the clock injected, so the latency math is unit-tested against a fake clock rather than the wall. Six new tests in tests/test_benchmark.py pin TTFT, inter-token latency, and throughput to the decimal; full suite 93 green, ruff clean. Then bench.py, a CLI that wires the real Llama-3.2-1B into that core and runs two sweeps, writing docs/daily/data/day-13-bench.csv. Day 11’s single “5.74x” is now a curve.
Why it matters
The KV cache’s whole claim is asymptotic: O(n) decode instead of O(n^2). A single data point cannot show an asymptote, it can only assert one. Today turns the assertion into a measured shape, and that shape is what motivates the next four weeks: the naive contiguous buffer is fast enough for one short sequence and falls apart exactly where real serving lives (long contexts, many sequences).
What I learned
The headline is two curves from the generation-length sweep (prompt fixed at 16, pure greedy so both paths do identical work):
| gen | cached | naive | speedup |
|---|---|---|---|
| 8 | 4.27s | 17.19s | 4.0x |
| 16 | 6.35s | 35.39s | 5.6x |
| 32 | 11.34s | 76.41s | 6.7x |
| 64 | 20.66s | (skipped) | n/a |
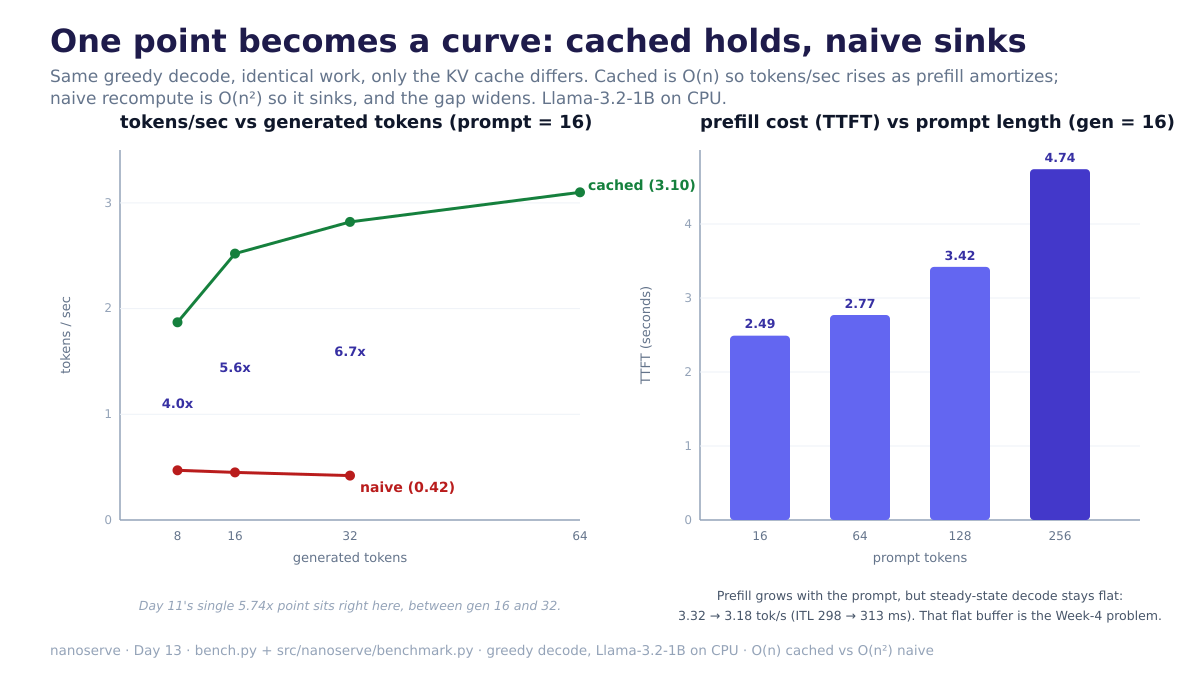
- Cached throughput rises with length; naive falls. Cached tokens/sec climbs 1.87 -> 2.52 -> 2.82 -> 3.10 as the one-time prefill amortizes over more decode steps. Naive drops 0.47 -> 0.45 -> 0.42, because every step re-runs attention over the whole growing prefix, so the per-token cost keeps rising. Same model, same tokens out; the only difference is whether the past is remembered or recomputed, and that difference is the entire O(n) versus O(n^2) story made into a picture. The speedup widening 4.0x -> 5.6x -> 6.7x is the asymptote showing up: Day 11’s lone 5.74x was just the value at one length, sitting right between gen 16 and 32 here.
- A benchmark has to verify its own arithmetic, or it is a confident guess. The timing core takes the clock as an argument. In production it is
time.perf_counter; in the tests it is aFakeClockthat returns a scripted sequence, so I can assert that a stream whose tokens land at t = 0, 2.0, 2.5, 2.9, 3.4 yields exactly TTFT = 2.0 and ITLs = [0.5, 0.4, 0.5], and that the single-token and empty-run corners come out 0 instead of dividing by zero. I trust the 6.7x because the function that computed it is pinned the same way the kernels are. - TTFT, ITL, and decode throughput are three different questions, so I report three numbers. TTFT (prefill + first token) is the wait before anything appears; ITL is the streaming cadence between later tokens; decode throughput is decode tokens over decode time with prefill excluded, because a one-time prefill cost should not be smeared into the steady-state rate. Folding them into one “tokens/sec” hides exactly the thing the second sweep exposes.
- The prompt-length sweep is the Week-4 motivation in one row. Holding generation at 16 and growing the prompt 16 -> 64 -> 128 -> 256, TTFT climbs 2.49s -> 4.74s (prefill is linear in prompt length) while steady-state decode stays flat: 3.32 -> 3.18 tok/s, ITL 298 -> 313 ms. So decode speed is fine; the problem coming in Week 4 is memory, not throughput. That flat contiguous buffer has to hold every prompt token for every sequence, pre-reserved to the max length, and that is what fragments and wastes VRAM the moment you want many sequences at once. Paging is the answer, and now there is a baseline to beat.
The numbers are CPU and small, so the absolute tokens/sec is not the point; the slopes are. Cached up, naive down, prefill linear, decode flat. Those four slopes are the whole argument for everything that comes after.
Diagram
cache-throughput-curve.svg. Left: cached versus naive tokens/sec across generation length, with the speedup widening. Right: TTFT climbing with prompt length while decode stays flat.
Tomorrow
Week 3 closes here (sampling, cache, both together, and now measured). Week 4 starts the paged cache: a BlockAllocator over a fixed pool of physical KV blocks, the OS-paging analogy that replaces this contiguous buffer. The stubs are already in cache.py waiting; this week’s curve is the before picture.
Post angle: Day 13 of building an LLM inference engine from scratch. Day 11 the KV cache gave me one number, 40 tokens 5.7x faster. One number cannot show an asymptote, it can only claim one, so today I turned it into a curve. Same greedy decode, identical tokens out, the only difference is whether the past is remembered or recomputed. Cached tokens/sec rises as you generate more (the one-time prefill amortizes): 1.9 to 3.1 tok/s. Naive falls (every step redoes the whole growing prefix): 0.47 down to 0.42. So the speedup widens with length, 4.0x at 8 tokens, 5.6x at 16, 6.7x at 32. That widening is the O(n) versus O(n squared) gap made visible, and the old 5.7x was just the value at one length. The part I am most happy with is that the benchmark checks its own math: the timing core takes the clock as an argument, so in the tests a fake clock feeds it scripted timestamps and I assert TTFT and inter-token latency to the decimal. A benchmark whose own arithmetic is unverified is just a confident guess. Second sweep, growing the prompt instead of the output: time-to-first-token climbs (prefill is linear in prompt length) but steady-state decode stays flat. So decode speed is not the next problem, memory is: that contiguous cache has to hold every prompt token for every sequence. That is the setup for next week, the paged cache. 93 tests green. #AI #LLM #vLLM #BuildInPublic #Claude #OpenAI