Day 49: the compiler, the twelve places my own code cut the graph, and the integer that undid the rest
Date: 2026-09-03 · Week 13 · Phase 5 Benchmark and optimize
What I added today
nanoserve.compiled, the module that puts the decode forward behind a compiler and counts what that actually bought. DecodeShape is the pair of dimensions a decode call presents (rows, and the [rows, max_ctx] mapping width, which is the longest history plus this step’s token); shape_history, distinct_shapes, recompiles and falls_back turn a run into the number of builds it asks for and whether that walks past dynamo’s cache_size_limit. bucket_for, round_up, bucketed and bucket_padding_waste are the closed-shape-set trade, priced in cells. fragments, fragment_overhead_s, CompileReport and explain_forward are the graph-break half, and dynamo_unique_graphs and dynamo_frames_compiled are the two counters dynamo keeps, which are not the same number. The arithmetic is compile_cost_s, step_speedup (Amdahl over the forward’s share), saving_per_step_s, breakeven_steps, net_saving_s, worth_compiling and render; the gates are check_single_graph, check_no_fallback, check_graph_reused, check_shapes_bucketed and check_compile_amortised.
CompiledDecode is the wrapper: three modes (off, dynamic, static), an injectable compiler so the policy is testable without inductor, and an injectable graph counter defaulted to dynamo’s own. Engine(compile_decode=...) wires it, and the decode forward goes through engine.decode_forward whether or not anything is compiled, so the call site has no branch and the counters always exist. The prefill stays eager on purpose.
The change that outlives the day is smaller and is in two other files. paged_attention_batched_reference takes context_bounds, and BatchedPagedKVCache.context_bounds (plus the same on BatchedCacheRows) supplies them from BlockTable.num_tokens, which is already a Python int on the host. That deletes two int(tensor) calls per layer per step. compilebench.py at the root sweeps the modes, one torch._dynamo.reset() each, and writes day-49-compilebench.csv. tests/test_compiled.py is 82 tests. Suite 1257 green (5 GPU-gated skips), ruff clean.
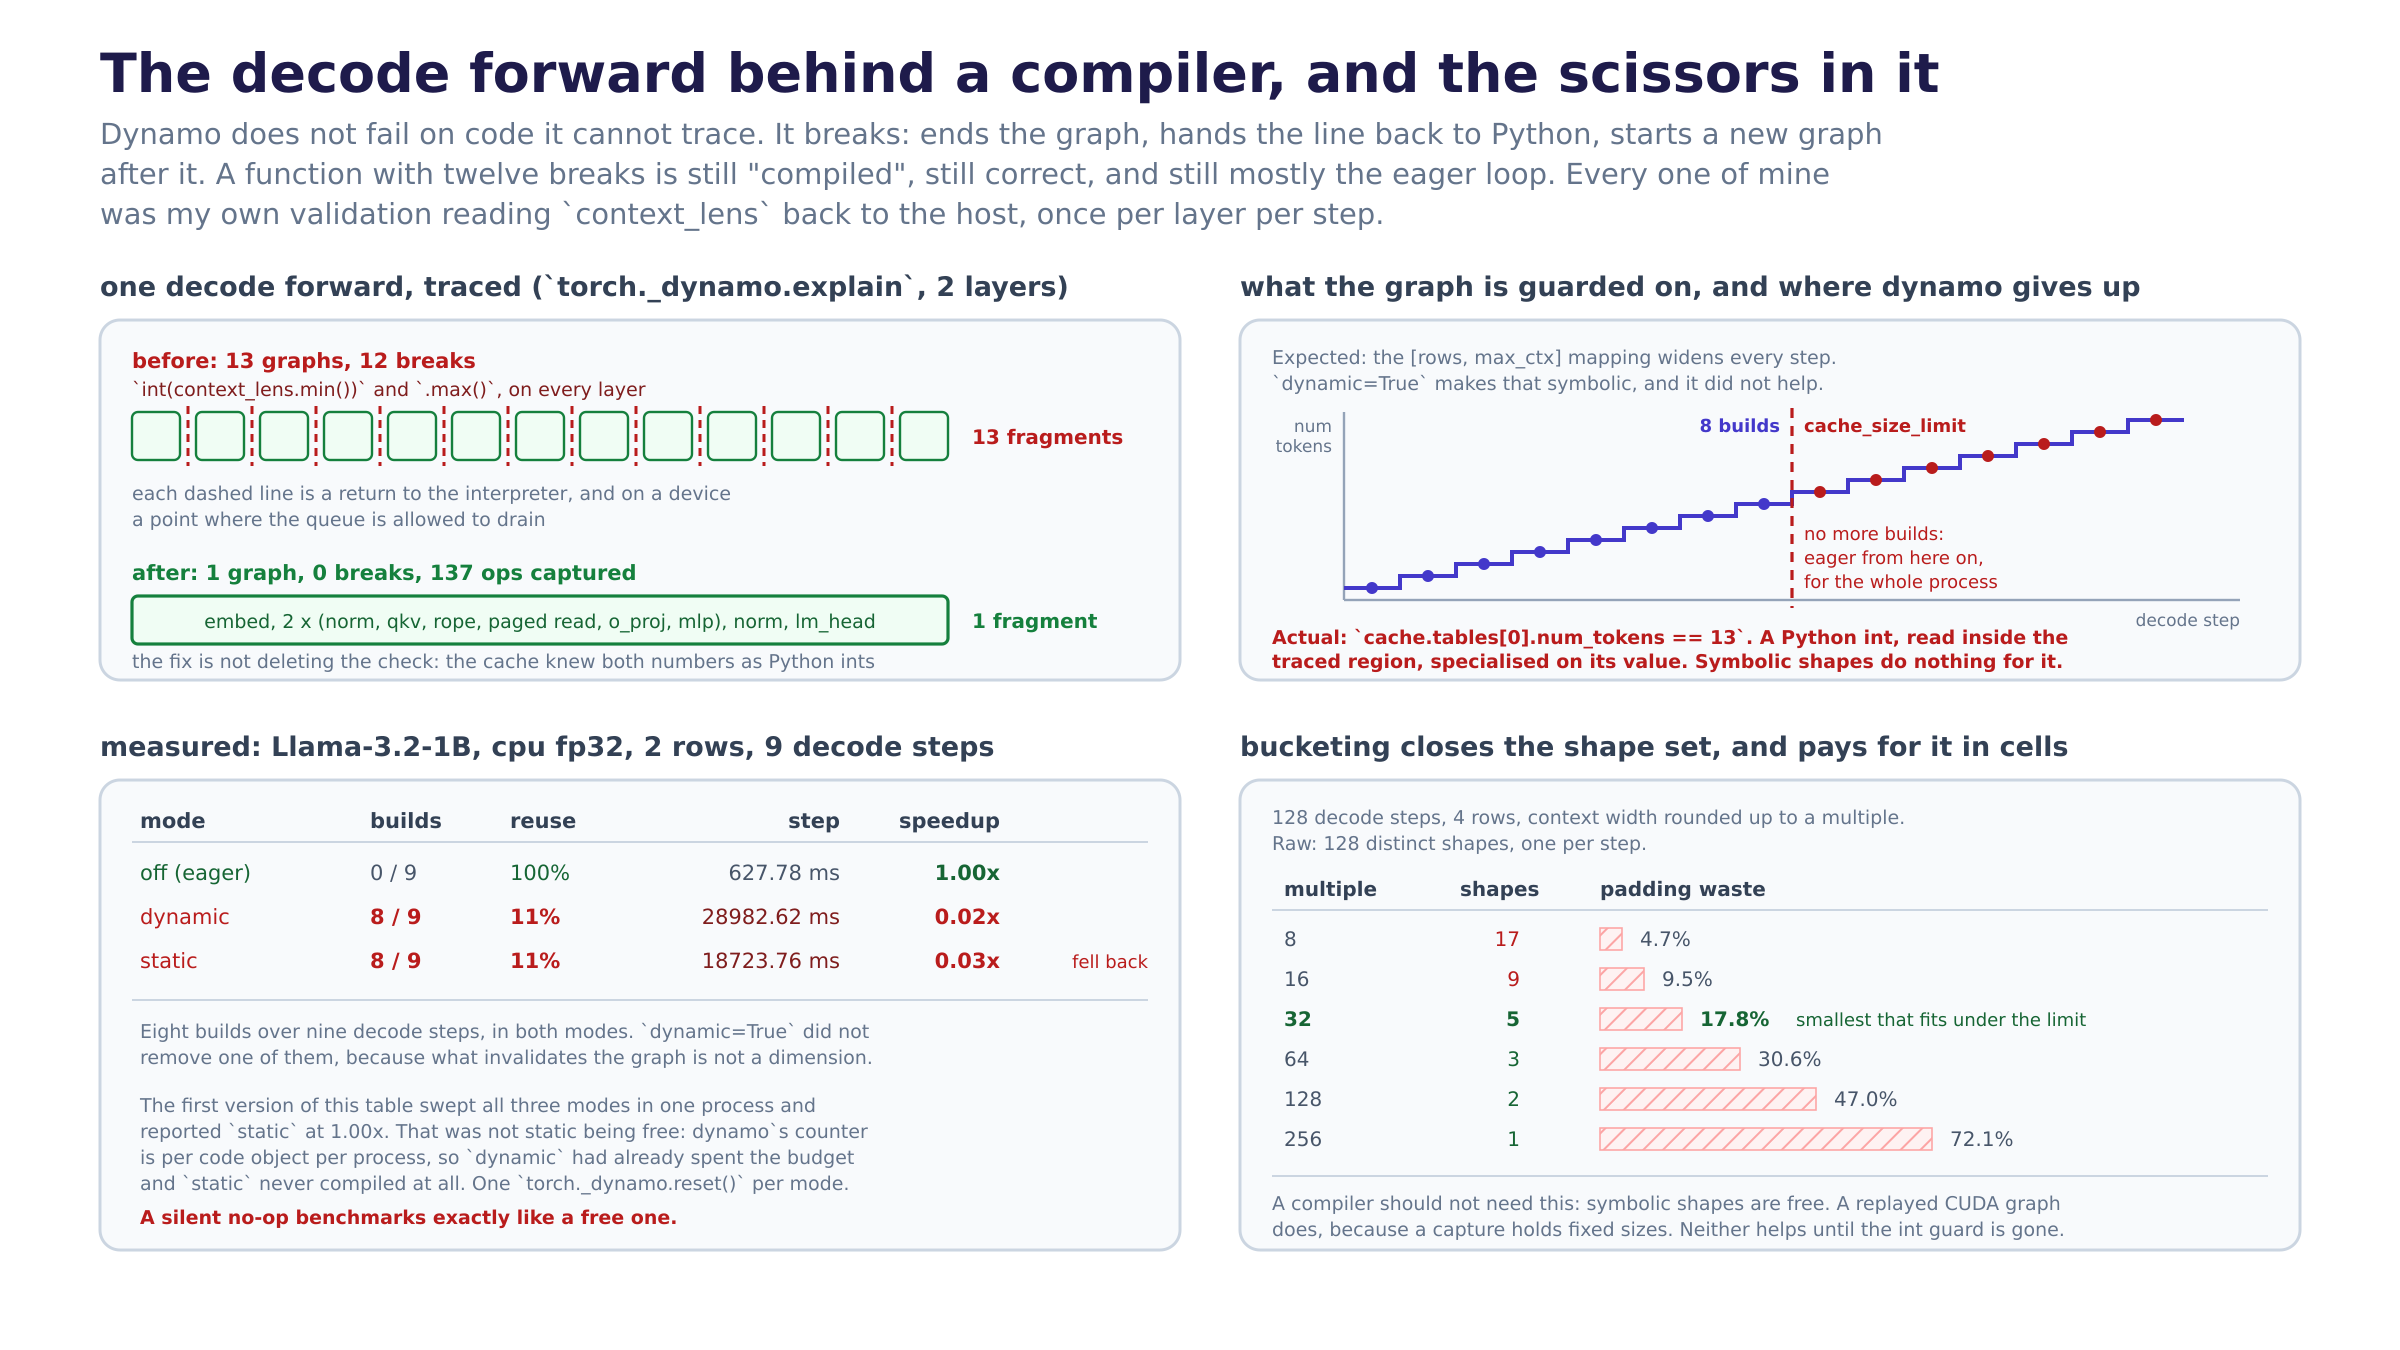
One decode forward, torch._dynamo.explain, before and after the bounds change:
layers   graphs   breaks   ops
  2        13       12     108      before
  4        15       14     136      before
  2         1        0     137      after
 16         1        0     977      after, the real Llama-3.2-1B
Why it matters
A compiler does not refuse code it cannot trace, and that is the whole trap. When TorchDynamo meets a line it cannot handle it ends the graph there, drops back into the interpreter for that line, and starts a new graph afterwards. The callable it hands back has the right signature, returns the right answer, and is made of fragments. There is no exception and no warning at default verbosity: torch.compile(model.forward) on this engine was thirteen graphs with twelve breaks in it, and it would have benchmarked as “compile does nothing on CPU, must be a small-model thing” if I had not asked. explain_forward is the asking and check_single_graph is the gate, and both exist because the failure mode of this day is a plausible negative result.
Every one of the twelve was my own validation, and Day 48 had already found them. paged_attention_batched_reference checked its context_lens with int(context_lens.min()) < 1 and int(context_lens.max()) > max_ctx, once per layer, once per step. Day 48 wrote a test that monkeypatched tolist, item and __int__ into raising, expected a clean decode step, watched it fail inside that kernel, and narrowed its claim rather than chasing it. Seen as a synchronisation that is a cost. Seen through a tracer it is a pair of scissors: the graph ends at layer 0’s min() and the compiler never sees the shape of the model.
The fix was to move the check, not to delete it. Both numbers were already Python ints somewhere else in the process. BlockTable.num_tokens is host-side state the cache maintains itself, so BatchedPagedKVCache.context_bounds is a min and a max over a list, and the kernel takes them as an argument instead of asking the device. The validation is exactly as strong, the readback is gone, and one decode forward went from 13 graphs and 12 breaks to 1 graph and 0 breaks, on the tiny model and on the real Llama-3.2-1B (977 ops captured). That part of the day is a permanent improvement to the code and it would have been worth doing with no compiler in sight.
And then compiling it made the engine forty-six times slower. This is the result I did not expect and it is the one worth keeping. Llama-3.2-1B, cpu fp32, 2 rows, 10 iterations:
mode      shapes  builds  reuse  fell back    compile        step  speedup
off            9       0   100%         no      0.01s    627.78ms    1.00x
dynamic        9       8    11%         no          -  28982.62ms    0.02x
static         9       8    11%        yes      6.40s  18723.76ms    0.03x
Nine decode steps, eight builds, in both modes. dynamic=True did not reduce the build count by one. The compile column is the one number here I do not believe: it is estimated as the total decode time minus the median step times the step count, and when eight of nine steps contain a build the median step is itself a build, so the estimator has no baseline to subtract. It reports 0.00s for dynamic and 6.40s for static and both are artefacts. When a compile happens almost every step, “compile time” and “step time” stop being separable by subtraction, and the honest column is reuse.
The guard that fails is not on a shape. I had the story ready: a decode call is [rows, 1] over a [rows, max_ctx] slot mapping, max_ctx is the longest history and grows by one every step, so a static graph is one shape per step and dynamic=True fixes it by making both dimensions symbolic. All of that is true and none of it helped. What dynamo actually reported when it gave up was:
kwargs['cache'].cache.tables[0].num_tokens == 13
  # [table.slot(p) for p in range(start, table.num_tokens)], cache.py:729
num_tokens is a plain Python int, read off a plain Python object, inside the traced region. Dynamo specialises on its value, as a constant. dynamic=True makes tensor dimensions symbolic and does precisely nothing for that, which is why dynamic and static rebuild the same number of times. So the graph is invalidated every step, rebuilt every step, and after cache_size_limit (8) rebuilds dynamo stops compiling the frame and runs eager for the rest of the process, silently. The compile budget is spent and the compiled speed is never collected.
Bucketing is priced today and applied by nothing, on purpose. Rounding the rows to a power of two and the width to a multiple closes the shape set at a real price in cells the kernel computes and the mask throws away. For 128 decode steps at 4 rows: 128 raw shapes, 17 at a multiple of 8 for 4.7% padding, 5 at 32 for 17.8%, 1 at 256 for 72.1%. The smallest multiple that fits under a limit of 8 is 32, so closing this shape set costs about 18% of the attention rectangle. A compiler does not need to pay that; a replayed CUDA graph does, because a capture holds fixed sizes and fixed pointers, and vLLM’s list of capture batch sizes is exactly this table. Writing the arithmetic before the capture is the order Day 47 and Day 48 went in, and it worked there.
What I learned
- The compiled forward and the eager forward cannot be compared by calling both. My first equality test ran
model.forwardand then the compiled one over the same cache view and compared. It failed by whole units, not by a tolerance. A forward over a KV cache is not a function: the paged read writes this step’s K/V into the row before it attends, so the second call attends over a history one token longer and writes a duplicate slot. The test that means anything is two engines driven identically. The mistake was worth making, because it is the same mistake as benchmarking a cached decode twice and reporting the second number. - My benchmark’s third row was a function of its second row. The first run swept all three modes in one process and reported
staticat 613ms and 1.00x, which read as “static costs nothing”. It was not:dynamichad walked pastcache_size_limitthree minutes earlier, dynamo’s counter is keyed per code object per process, and by the timestaticran the frame was already marked and never compiled at all. The fix is onetorch._dynamo.reset()per mode. What makes this worth writing down is that the contaminated number was the believable one: a mode that silently does nothing benchmarks exactly like a mode that is free. - I picked the wrong counter, and the wrong counter agreed with me. I measured builds with
torch._dynamo.utils.counters["stats"]["unique_graphs"], which counts distinct graph structures. A frame rebuilt eight times because a guard on an integer kept failing has the same structure every time, so the counter reported 1 build for a run that had done 8 and spent six minutes doing them.counters["frames"]["ok"]is the build count. A measurement that confirms the thing you hoped for deserves more suspicion than one that does not. - Amdahl’s ceiling is a fact about the machine, not about the change. I went in expecting to write that compiling the forward cannot help much because Day 46 found the step was mostly host loop. Day 46’s own CSV says otherwise on this box:
loop_shareis 0.0008 andtop1isforwardat 99.9% of the step. On a CPU the model is the step, so the ceiling is the forward’s own speedup and Amdahl has nothing to subtract. On a GPU the profile inverts and the same change is capped at1/(1 - loop_share).step_speeduptakes the share as an argument for that reason: a speedup quoted without the share it was measured against is a property of a laptop. - The graph break count scaling with the layers is how I knew it was structural. Two layers traced to 13 graphs, four traced to 15: one more break per layer over a fixed base. That linearity said “this is inside the block, not in the entry” before I had read a single break reason. A count that had stayed at 13 would have been a preamble problem and a much shorter day.
falls_backis the property I would keep if I could keep one. Recompiling is slow and visible. Exceeding the cache limit is silent and permanent: dynamo marks the frame, runs eager, and the process keeps producing correct tokens at eager speed having already paid for eight builds. There is no attribute to read that says so. Predicting it from the shape history is the cheap way to find out, and a decode loop walks into it in eight steps without doing anything unusual.- Taking the compiler as an argument is what made the day testable. Most of what
CompiledDecodedoes is policy: which shapes reach the compiler, how many builds that implies, when the answer is “this will fall back”. None of it needs inductor. With a fake compiler that builds nothing, the policy tests run in milliseconds and the handful that need the real thing are the ones asserting about real graphs. Same seam as Day 46’sDeviceTimer, and I should have reached for it sooner. - The prefill staying eager is a decision, not an omission. A prefill’s rectangle is
[admitted, longest prompt]and both move on almost every admission, so it is the decode path’s shape churn and worse. It is also where the work per call is largest, which makes it the more tempting target and the one a static graph would abandon fastest.
Diagram
compiled-decode.png. Left top is one decode forward traced twice: thirteen fragments with a dashed break between each pair, then one captured region. Left bottom is the measured sweep. Right top is the guard that actually fails, climbing one integer at a time into the recompile limit, with the point past which no more graphs are built. Right bottom is the bucketing trade, shapes against padded cells.
Tomorrow
The compiler is wired, the breaks are gone, and the thing standing between this engine and a graph it can keep is one line of host bookkeeping inside the traced region: [table.slot(p) for p in range(start, table.num_tokens)] in BatchedPagedKVCache.write. Day 50 moves the slot addressing out of the forward, the way Day 49 moved the bounds out of the kernel: build the write’s slot mapping on the host before the forward is called and hand it in as a tensor, so nothing the tracer sees reads a Python attribute that changes every step. Then re-run compilebench.py, and check_graph_reused is the test that says whether it worked: one build over N steps rather than eight over nine. After that the bucketing arithmetic written today has something to be measured against, because a CUDA graph capture is the next thing that needs a closed shape set.
Post angle
Day 49 of building an LLM inference engine from scratch. I put torch.compile on my decode step and made it 46x slower, and the whole day is in why. First: dynamo never fails on code it cannot trace. It breaks the graph, runs that line back in Python, and starts a new graph afterwards, so you get a callable that is correct, looks compiled, and is thirteen fragments with the interpreter between them. Mine was 13 graphs and 12 breaks, and every break was my own paged-attention kernel calling int(context_lens.min()) to validate, once per layer per step. Day 48 had already tripped over those as synchronisations and narrowed its claim rather than chase them. The fix was not deleting the check: both numbers were already Python ints in the cache, because BlockTable.num_tokens is host state, so the cache hands the bounds down and the kernel never asks the device. 13 graphs and 12 breaks became 1 graph and 0 breaks, on the tiny model and on the real 1B (977 ops captured). Then I compiled it: 628ms a step eager, 28,983ms compiled. The guard dynamo kept failing was not a shape at all. It was cache.tables[0].num_tokens == 13, a plain Python int read inside the traced region and specialised as a constant, so dynamic=True (which only makes tensor dims symbolic) changed nothing: 8 builds over 9 steps in both modes. After 8 rebuilds dynamo stops compiling that frame and runs eager for the rest of the process, with no exception and no log line at default verbosity. Two smaller things cost me real time. My first benchmark ran all three modes in one process and reported static at 1.00x, which was not static being free, it was static never compiling because dynamic had already exhausted the frame’s budget: one torch._dynamo.reset() per mode. And I measured builds with unique_graphs, which counts distinct graph structures, so it reported 1 build for a run that had done 8. This is the bookkeeping vLLM and SGLang keep outside the traced region, and now I know exactly which line teaches you why. 1257 green.