Day 58: the persistent batch, and the move that is only a relabel
Date: 2026-09-14 · Week 13 · Phase 5 Benchmark and optimize
What I added today
nanoserve.compact, and the scheduler change it plans for.
RowMove is a frozen (src, dst) with a render, because it travels: planned on the host, applied by a callback that owns tensors, reported on the SchedulerOutput, read back by the gates. is_compact, holes and strays are the three questions, and the fact that there are always exactly as many strays as holes is what makes a compaction a permutation rather than an allocation. plan_compaction pairs them sorted against sorted; moves_needed and move_cells are the price. RowCompactor holds the mode, the on_move callback and three counters (calls, compactions, moves), and the distance between the first two is the day’s cost claim.
SlotTable.move_row is the device half: one row copy of length(src) cells inside the buffer, so the address a recorded window holds does not change, and the refusal is that dst must be empty. BatchedPagedKVCache.move_row is the tenancy: the BlockTables are swapped (so src comes back holding the empty one), the slot table row follows, and the Day-50 gathered mapping is invalidated rather than reindexed.
Scheduler(compact_rows=True) puts _compact between _grow_running and _admit. The engine installs scheduler.compactor.on_move = self._move_row next to on_release, and Engine.build, build_engine and build_app thread compact_rows through unbundled. serve.py is where it bundles: --cuda-graphs turns it on, and --no-persistent-batch separates the two again for measuring one without the other. captured.rows_are_a_prefix now delegates to compact.is_compact, so the question the decode path asks every step and the one the scheduler answers every schedule are one definition.
Day 57’s check_arm_replayed_every_step was written as the assertion that failed on purpose. It passes. The socket-level control that it is measuring a flag and not describing an engine is a one-arm run launched compact_rows=False.
tests/test_compact.py is 64 tests. Suite 1807 green (5 GPU-gated skips), ruff clean.
graphbench.py --coverage, host only, no weights (day-58-graphbench.csv):
what share of a decode loop can replay at all, by workload shape:
     batch  slots  requests    gen lengths  decode steps  replayed  scattered   share  moves   cells
 free rows      4         8             16            30        30          0   100%      0       0
 free rows      4         8           8/16            31        21         10    68%      0       0
 free rows      4         8           4/32            43        36          7    84%      0       0
 free rows      8        16             16            30        30          0   100%      0       0
 free rows      8        16           8/16            31        14         17    45%      0       0
 free rows      8        16           4/32            47        35         12    74%      0       0
 free rows      8        16      4/8/16/32            47        12         35    26%      0       0
 free rows     16        32           4/32            51        34         17    67%      0       0
persistent      4         8             16            30        30          0   100%      0       0
persistent      4         8           8/16            31        31          0   100%      3      33
persistent      4         8           4/32            43        43          0   100%      5      95
persistent      8        16             16            30        30          0   100%      0       0
persistent      8        16           8/16            31        31          0   100%      6      66
persistent      8        16           4/32            47        47          0   100%     11     217
persistent      8        16      4/8/16/32            47        47          0   100%      8      80
persistent     16        32           4/32            51        51          0   100%     23     461
Why it matters
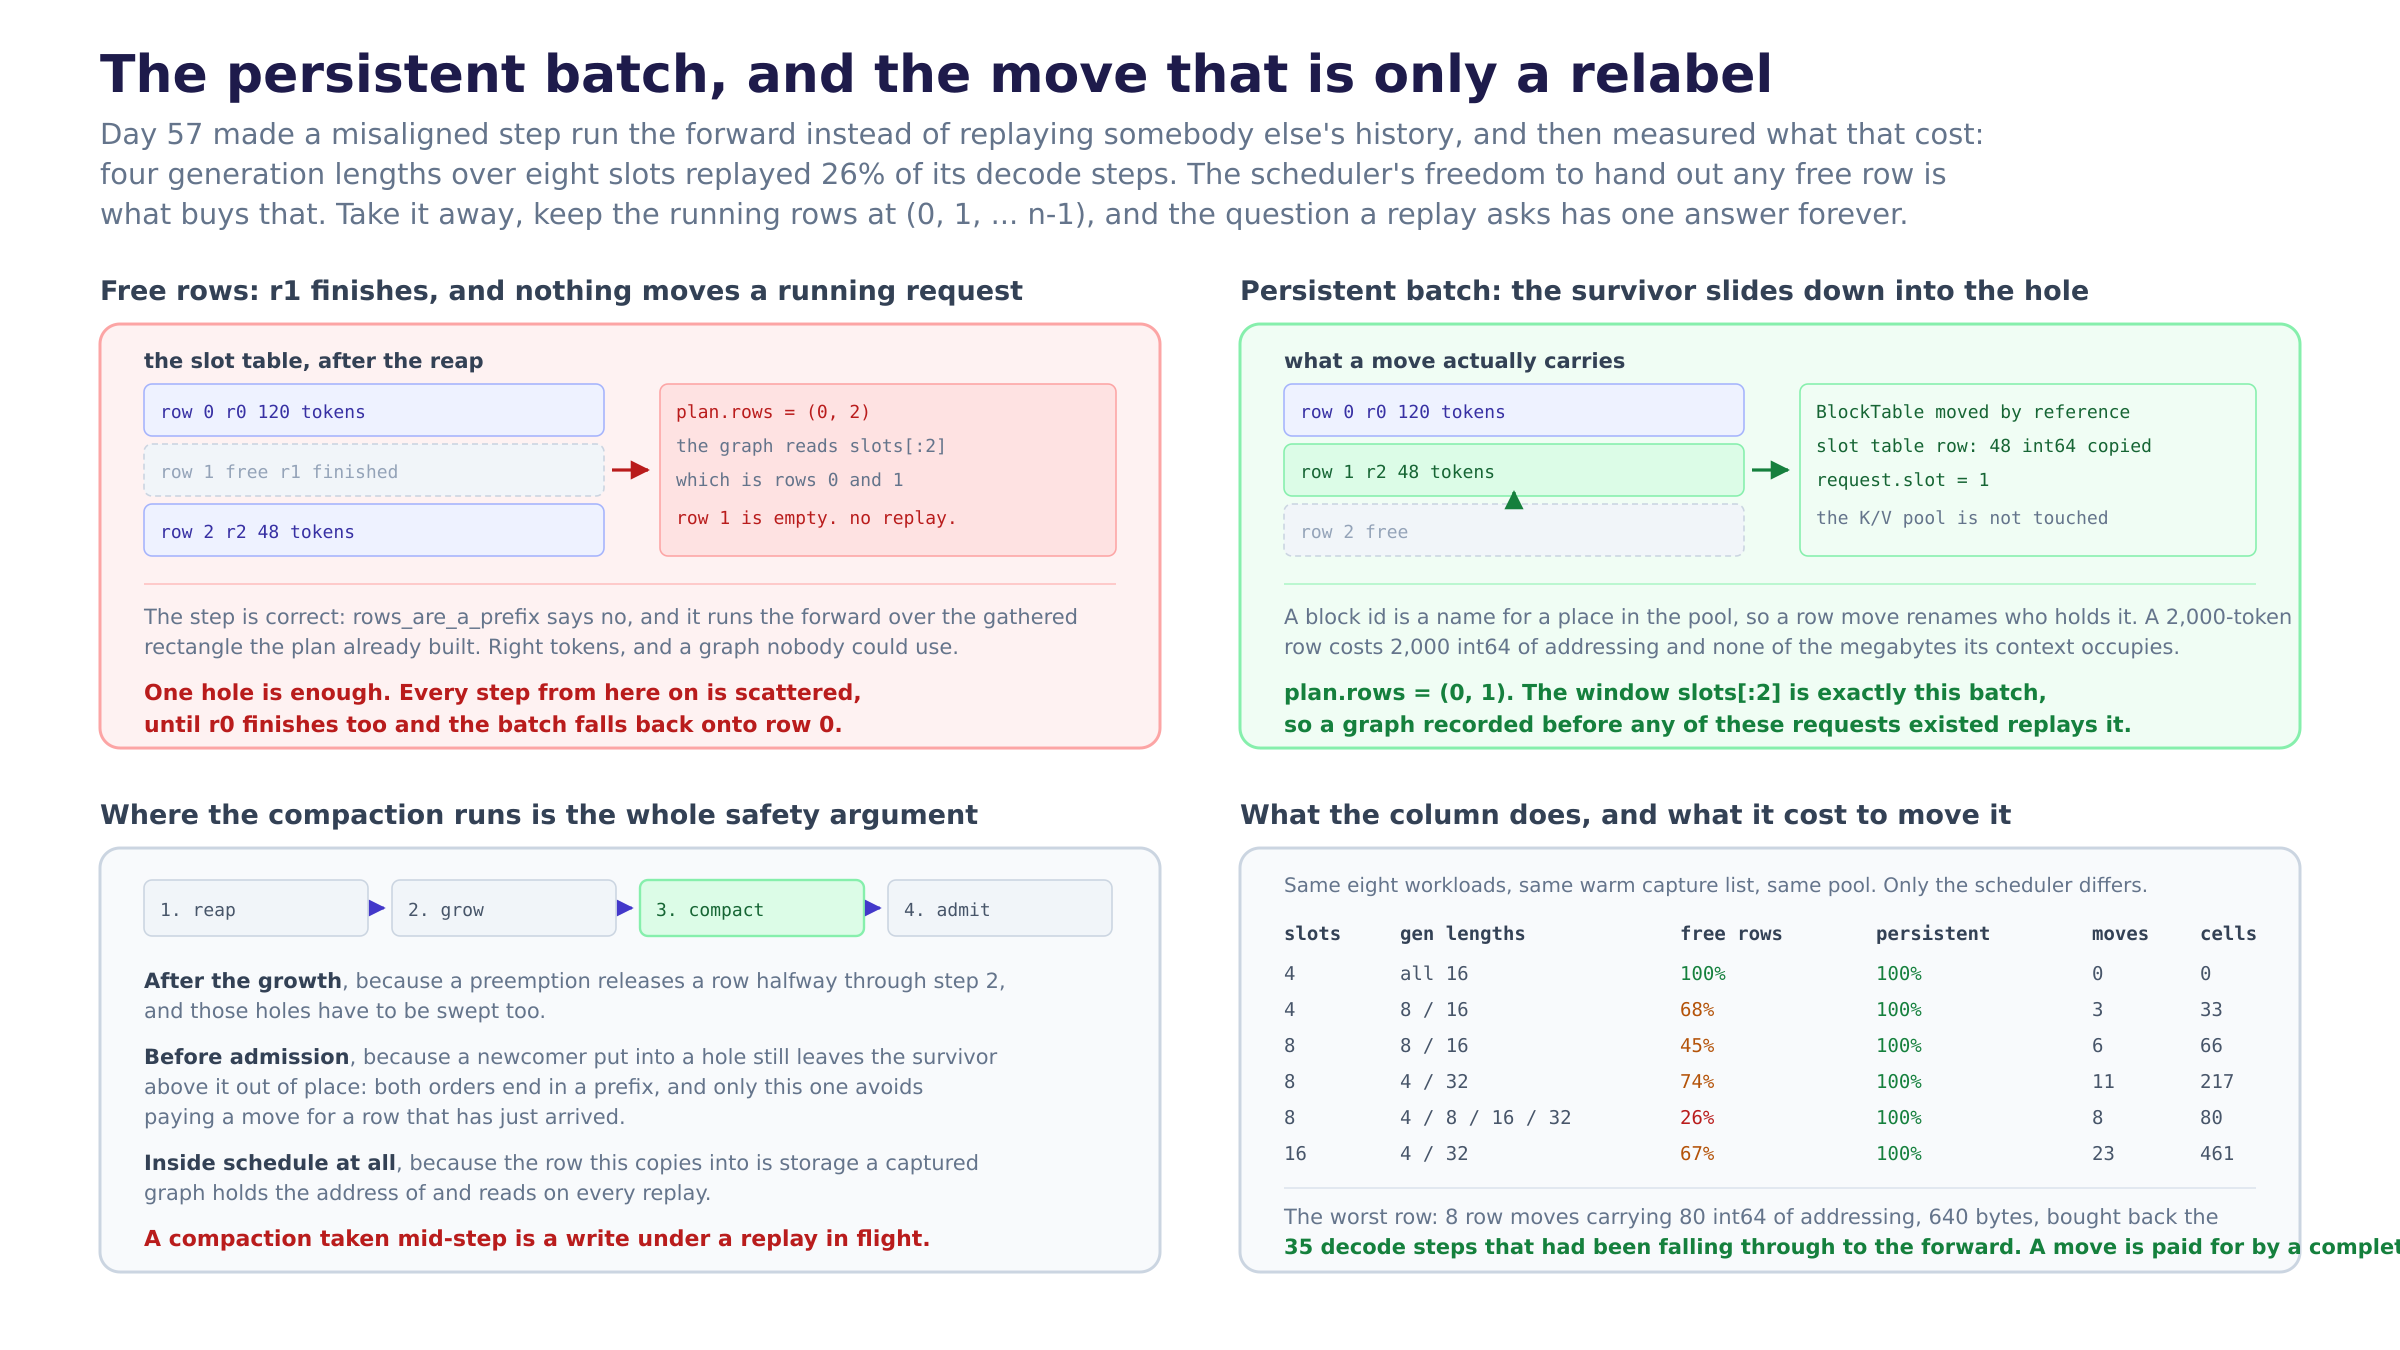
The whole of yesterday’s finding is bought back for 640 bytes. The row that replayed 26% of its decode steps replays all of them, and what it paid is 8 row moves carrying 80 int64 of addressing. That ratio is the point: 35 decode steps that had been falling through to the forward, against eight copies of a few dozen integers. Nothing about the capture list changed, nothing about the buckets changed, and the recorder is the same. What changed is which row a survivor is sitting in.
A move is a relabel, and the reason it is cheap is the reason paging exists. A block id is a name for a place in the pool. Moving a row moves the BlockTable holding those names (a host object, by reference), the slot table’s row of addressing (one device row copy), and the request’s slot id. The K/V is not read and not written. A 2,000-token row costs 2,000 int64 and none of the megabytes its context actually occupies, and the same compaction in an engine that kept per-sequence contiguous caches would be a copy of the context itself. This is the first day where the shared pool bought something other than utilisation.
Where the compaction runs is the entire safety argument, and it has three parts. After the growth, because _grow_running releases rows halfway through when it preempts, and those holes have to be swept too. Before admission, because a newcomer put into a hole still leaves the survivor above it out of place: both orders end in a prefix, and only this one avoids paying a move for a row that has just arrived. And inside schedule at all, because the row this copies into is storage a captured graph holds the address of and reads on every replay. A compaction taken mid-step is a write under a replay in flight, and it would be the same class of bug as yesterday’s with the same absence of an exception.
The cost is bounded by completions, not by steps, and that is a different kind of number. A hole is made by a release and filled by one move, so moves <= releases over any run, which check_moves_amortised states as a gate. A decode loop that finishes nobody pays one tuple comparison per schedule and copies nothing: the sixteen uniform-length requests in the table above did zero moves. So a persistent batch is not a per-step overhead traded against a per-step saving, it is a per-request tidy-up against a per-step saving, and those do not compete.
Two of the three gates I wrote are about cost rather than correctness, and I nearly did not write them. check_moves_minimal fails two ways and they are different mornings: too few moves leaves a batch that still cannot replay, and too many is a compaction that copied rows already in place. Both produce a prefix. Only the second is invisible, which is why it needs a gate rather than a test of the outcome.
rows_are_a_prefix moved into the module that answers it. Yesterday it was a one-line tuple comparison on the decode path. Today the scheduler maintains the property every schedule and the capture checks it every step, and two copies of the same predicate that drifted would produce a batch the scheduler calls compact and the capture declines to replay: a silent fall-through to the forward with every counter saying it should not be happening. One definition, and the plan-shaped door onto it stays where callers already import it from.
What I learned
- The expensive-looking operation was the cheap one, and I had been avoiding it for three weeks without pricing it. “Nothing moves a running request” reads like an invariant protecting something. It protects nothing; it was a consequence of the free-slot heap being the obvious way to hand out rows, and the first time anybody asked what a move would actually cost was today.
- A scheduler policy and a kernel property met three weeks apart. The free-slot heap is Week 8 and the recorded window is Week 13, and neither is wrong. What was wrong is that nothing in between ever stated the relationship, so the bill arrived as a coverage number rather than as a design decision.
- Swapping the two tables is shorter than assigning one and constructing another.
tables[src], tables[dst] = tables[dst], tables[src]leaves the empty table in the source row, so the invariant that every row index has aBlockTablesurvives an operation that only one row was nominally involved in. Assigning and rebuilding would have been two more lines and one more thing to get wrong on a reset. - The refusal that
dstmust be empty is the gate I would have skipped as defensive. It is not. A destination that still holds tokens means the plan was built against a different occupancy than the table has, and going ahead writes one request’s addressing over another’s: yesterday’s bug arriving through the other door, with the same silence. - Flag bundling belongs at exactly one layer, and it is the CLI.
--cuda-graphsshould turn the persistent batch on, because a capture that covers a quarter of the loop is not what an operator asking for CUDA graphs means.build_appshould not, because compaction is a scheduler property that is correct with the graphs off and because a benchmark needs to hold one still while it moves the other. Day 56 made the same split for three flags; this is the fourth and it did not need a new argument. - The persistent batch goes to both arms of the comparison, and that took a moment to see. Giving it only to the graphed arm would have made the gap between the two reports attributable to two changes at once. The eager arm pays the same row copy per completion for none of the benefit, which is the honest shape of the experiment and also the honest answer to whether compaction alone is worth having.
- A counter that is three counters says something none of them says alone.
calls,compactionsandmoveslook redundant until a run reports 47 calls, 8 compactions and 8 moves, which is the sentence “most steps looked and found nothing to do”. One number would have made a persistent batch look like a per-step cost. - The tri-state flag is the right shape for “follows another flag unless you say otherwise”.
--persistent-batchdefaulting toNoneand--no-persistent-batchsharing its dest gives three states out of two switches, and the default is a sentence rather than a value: unset means follow the capture. The alternative, defaulting it toTrue, would have quietly changed what every launcher call in the repo built. - vLLM’s persistent batch is the precondition, not the optimisation. I wrote yesterday that I had read it as a scheduler detail. Having implemented it, the sharper version is that their capture list is only sized over batch sizes because the rows are always a prefix, so the shapes they have to hold are one axis rather than two. The persistent batch is not a thing they do to make graphs faster; it is what makes a capture list finite.
Diagram
persistent-batch.png. Left top is the free-row scheduler after a reap: rows (0, 2), the window slots[:2] reading rows 0 and 1, and the hole that makes every step from here scattered. Right top is the same moment compacted, with the three things a move actually carries and the one it does not. Left bottom is where the compaction sits in schedule and the three reasons it sits there. Right bottom is the measured table, both schedulers, with the moves and cells each 100% cost.
Tomorrow
The capture is correct, warm, wired and now covering the whole loop, so Week 13 is closed and the number it was all for has never been measured on a card. Day 59 is graphbench.py --weights ./weights --device cuda --rates 1,2,4,8, the two arms on real hardware, with the ITL p50 and p99 reported separately for the reason Day 57 gave: the capture’s claim lives in the middle of the distribution and the warm-up’s lives only in the tail. The honest expectation is still that the gap is smaller than the arithmetic says, because Day 49’s compile already removed some of the launches a graph would have saved, and --no-compile is the third arm that separates them. If that lands, the thing Week 14 wants is the one replay_share cannot see: a step is a replay now, and the read inside it is still paged_attention_batched_reference, which materialises a [rows, heads, 1, ctx] score rectangle before it masks. That is the tensor workspace_bytes prices and the one vLLM’s paged kernel never builds.
Post angle
Day 58 of building an LLM inference engine from scratch. Yesterday’s acceptance test found that my CUDA graphs could only replay a quarter of a real decode loop, so today I fixed the cause, and the fix is smaller and weirder than I expected. The cause: a recorded graph reads the window slots[:rows], which starts at cache row zero, so it can only replay a step whose scheduler rows are (0, 1, … n-1). My scheduler hands out whichever row is free, lowest index first, and nothing ever moves a running request. So the moment one request in a batch finishes before its neighbour, the survivor is stranded in row 1, the batch is one row, and no graph in the list addresses it. Four generation lengths over eight slots: 26% of steps replayed. More slots made it worse. The fix is the persistent batch, which is what vLLM and SGLang keep and which I had read as a scheduler detail. Keep the running rows compacted: when a completion leaves a hole, slide the highest running row down into it. What I did not expect is how cheap that is. A move does not touch the K/V at all. A block id is a name for a place in the pool, so what changes hands is the block table (a host object, moved by reference), the slot table’s row of addressing (one device row copy of that row’s own length), and the request’s slot id. The worst workload in my table paid 8 row moves carrying 80 int64 (640 bytes) and got back 35 decode steps that had been falling through to the eager forward. And the cost scales with completions, not steps: a loop that finishes nobody compacts nothing. The part that took the longest to get right was not the move, it was where to run it. It has to be after the growth (a preemption frees rows halfway through), before admission (otherwise a newcomer lands in the hole and the survivor still has to move), and strictly between steps, because the row it copies into is storage a graph holds the address of and reads on every replay. Day 57’s check_arm_replayed_every_step was written as the assertion that failed on purpose. It passes. 1807 green.