Day 57: the acceptance test, and the row the replay was reading
Date: 2026-09-13 · Week 13 · Phase 5 Benchmark and optimize
What I added today
The Week 13 acceptance test, and what it found in the first ten minutes.
nanoserve.graphbench runs two servers, one launched with the graphs and one without, over the same ClientPlan list. run_arm is two passes and two readings: a crowd, whose answers are what the arms are compared on, then an open-loop run, which is where the cadence comes from, with /health read before the first request and after the loop goes idle. ArmReport holds the name, the texts, the LoadReport, the two readings, the boot decision and peak_running; ArmDelta is the pair, with itl_p50_speedup, itl_p99_speedup, the milliseconds each is worth, row and render. Seven checks: check_same_answers, check_arm_was_crowded, check_arm_replayed, check_arm_replayed_every_step, check_nothing_recorded_while_serving, check_arms_comparable and check_tail_not_worse, split across two exception types that Day 41 and Day 42 already named, because “the capture made it worse” and “this pair of runs cannot say anything about the capture” are different mornings.
CaptureStats is the counters as a value: of, from_dict, as_dict, render, and since, which is the day’s instrument. AsyncEngine.stats publishes it and server.health_payload merges it into Day 56’s boot section under runtime rather than over it. check_all_shapes_captured and check_replays_dominate now take a reading as readily as the object, so the two gates Day 54 wrote can finally be asked of a process from outside it.
And the fix. rows_are_a_prefix is one tuple comparison, CapturedDecode routes a step that fails it to the forward and counts it in scattered_calls, check_no_scattered_rows prices that as a share, and replay_share is the number next to reuse that says what fraction of the loop the capture actually covered.
tests/test_graphbench.py is 69 tests. Suite 1740 green (5 GPU-gated skips), ruff clean.
graphbench.py --coverage, host only, no weights (day-57-graphbench.csv):
what share of a decode loop can replay at all, by workload shape:
 slots  requests    gen lengths  decode steps  replayed  scattered   share
     4         8             16            30        30          0   100%
     4         8           8/16            31        21         10    68%
     4         8           4/32            43        36          7    84%
     8        16             16            30        30          0   100%
     8        16           8/16            31        14         17    45%
     8        16           4/32            47        35         12    74%
     8        16      4/8/16/32            47        12         35    26%
    16        32           4/32            51        34         17    67%
Why it matters
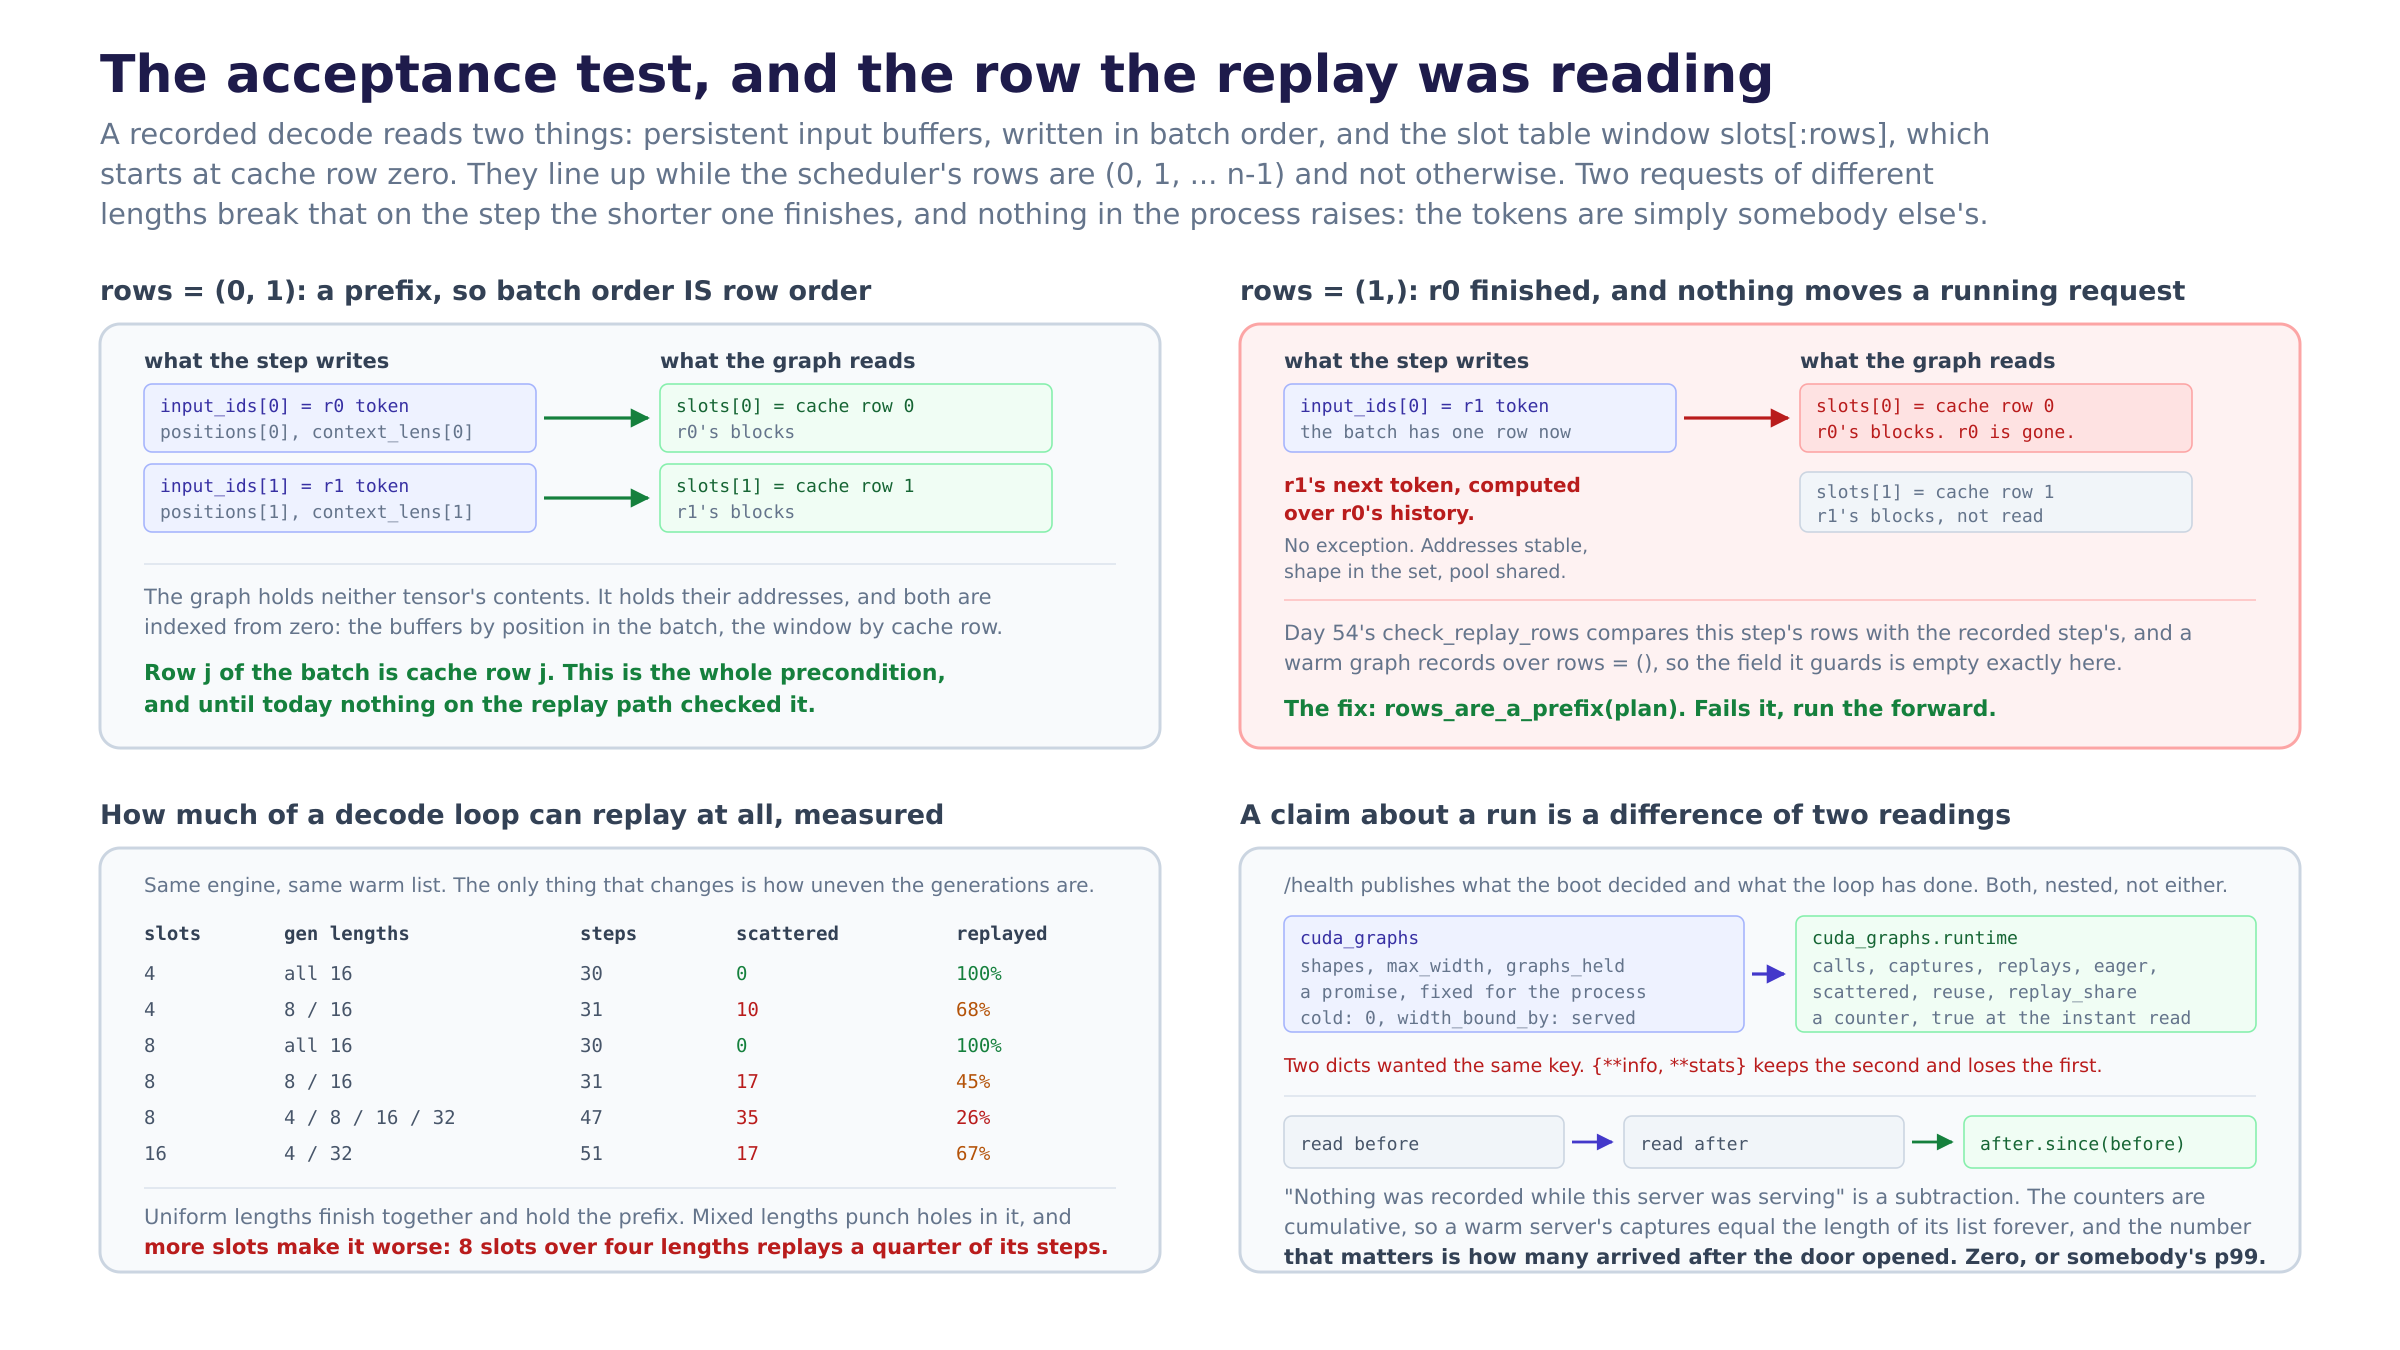
A warm capture was handing requests their neighbour’s history, and every gate in the repo passed. A recorded decode reads two things. The persistent input buffers, which the step writes in batch order: row 0 of input_ids is the first request of this step. And the slot table window slots[:rows, :width], which is cache row order and starts at row zero. They are the same index only while the scheduler’s rows are (0, 1, ... n-1). Two requests of different lengths break that on the step the shorter one finishes: the survivor stays in cache row 1 because nothing moves a running request, the batch is now one row, and the replay computes its next token over cache row 0’s keys and values. The addresses were stable, the shape was in the set, the pool was shared, the graph was warm, the output buffer was not held, and the answer was a different sequence’s continuation.
It could only be found by a crowd, and my first version of this file compared answers from a pass where each client ran alone. That is the part worth keeping. A solo request is one row in cache row zero, which is the single batch shape a misaligned replay gets exactly right, so the test I wrote to catch this passed against it. Every component test from Day 49 to Day 56 has the same property by construction: they hold a batch still and ask a question about it. The condition needs two requests, different lengths, and the step in between.
Row equality was the wrong invariant in both directions. Day 54’s check_replay_rows compares this step’s rows with the recorded step’s, which is too weak and too strong at once. Too weak because a warm graph is recorded over rows = (), so on the list a deployment actually runs, the field it guards is empty exactly where the check was needed. Too strong because a three-row step and a four-row step of the same bucket read the same window and write the same buffers, so one graph serves both, and demanding equality would push a server back to eager for every batch that is not the size it was recorded at. The property is that this step’s rows are a prefix. Nothing about the recording enters into it.
The share of a decode loop this engine can replay is not close to one, and the table is the argument for tomorrow. Uniform generations hold the prefix and replay 100% of their steps. Two lengths at eight slots replays 45%. Four lengths at eight slots replays 26%: three quarters of the decode steps in a perfectly ordinary workload cannot use any graph in the list. More slots makes it worse, which is the opposite of the direction a capture is supposed to scale, and the reason is that a wider batch has more chances to be something other than a contiguous run from zero. Everything Week 13 built is reachable; a quarter of the loop is where it is reaching.
A counter is cumulative, so every claim about a run is a subtraction. A warm server’s captures equals the length of its list forever, and the number that matters is how many recordings arrived after the door opened. since is eleven lines and it refuses a negative component rather than clamping it, because a window that ran backwards is not a small number, it is a reading from a process that restarted between the polls or two arms whose readings got swapped, and both of those produce a window that passes every check in the file.
Two dicts wanted the same key and ** keeps the second. Day 56’s boot payload has a cuda_graphs section and so does the live one, and merged flat, the boot half vanishes silently: a payload reporting 40,000 replays and nothing about how many shapes this server promised to hold. They are also different kinds of claim, which is the better reason to nest rather than flatten. The boot keys are promises, fixed for the life of the process. The runtime keys are counters, true at the instant they were read and stale by the time they are printed, and a reader who cannot tell those apart will quote a counter as a configuration.
What I learned
- An acceptance test’s job is to hold the thing the unit tests hold still. Every day of this week fixed a batch and asked a question about it, which is what made those days tractable. The bug lives in the transition between two batches, and there is no component whose test would naturally contain one.
- A comparison that runs each client alone is not a serving test, it is a slower unit test. The cost of the crowd is real: it is non-deterministic in batch composition, and the only reason it can be compared byte for byte is Day 40’s per-request generators. Having paid for that property, the acceptance test has to spend it.
- A gate over a field that is empty in production is worse than no gate. It passes, it is listed in the docstring, and it makes the arc look closed. Day 55 even reported this as a feature: a warm graph is “unbound”, so
check_replay_rows“has nothing it can be wrong about”. That was exactly right and exactly the problem, and I wrote both halves of it a day apart without noticing. - When a gate is checking a relationship, ask which of the two sides the property is actually about. Rows-equal-rows is a statement about two steps. Rows-are-a- prefix is a statement about one, and it turns out neither step needed to know anything about the other.
- The cheap gate was available the whole time. It reads a Python tuple the host already built, so it costs nothing on a device, which is the same test Day 54 applied to decide which checks could run every step. I had the criterion and I had not asked the question the criterion answers.
- A correct fallback is better than a loud refusal when the alternative is a dead loop. A scattered step runs the forward the eager engine would have run, over the gathered rectangle the plan already built, and gets the right tokens. The cost is a counter, and the counter is the thing to page on: refusing would have turned every out-of-order completion into a 500 and the server into a restart loop.
- The number that says whether a capture is working is not its reuse. A server that records nothing and replays half its steps is 100% reused and 50% covered.
reuseasks whether the recordings were worth making;replay_shareasks how much of the loop they are covering, and only the second one moved when the bug was found. - A sampled instrument reads zero for two unrelated reasons. The acceptance run failed once under the full suite and passed alone, and the message was that the crowd never had two requests running. It had eight.
peak_runningcomes from a watcher polling/healthevery 5 ms, and eight four-token answers from a toy model are over before the second poll. One means the clients really were serialised; zero means the run was too short to observe, and the fixes are opposite. The workload is longer now, and the check says which reading is which. - The scheduler’s freedom to hand out any free slot is a cost nobody had priced. It is a reasonable design and it makes slot allocation O(1), and the bill arrives three weeks later as the reason a graph cannot be replayed. vLLM keeps a persistent batch, and until today I read that as an implementation detail of their scheduler rather than as the precondition that makes their capture list usable.
Diagram
replay-row-window.png. Left top is the aligned case: what the step writes in batch order against what the graph reads from row zero, with the two lining up. Right top is the same picture after one request finishes, with the red arrow into cache row 0 and the gates that all pass anyway. Left bottom is the measured coverage table. Right bottom is /health carrying both halves, and the window as the difference of two readings.
Tomorrow
The capture is correct now and it is covering a quarter of the loop, so Day 58 is the persistent batch: keep the running rows compacted so plan.rows is always (0, 1, ... n-1) and scattered_calls goes to zero by construction. The work is a row move on completion (the slot table row, the block table and the request’s slot id all have to agree afterwards) and a decision about when: compacting on every completion copies more than compacting lazily, and a compaction taken mid-step is a write into storage a graph is replaying over. The number to beat is in today’s CSV, and the check that will say whether it worked already exists: check_arm_replayed_every_step is the assertion that currently fails on purpose. After that, the two arms on a real card, which is the half of this day the box could not run: graphbench.py --weights ./weights --device cuda --rates 1,2,4,8, with the honest expectation that the gap is smaller than the arithmetic says because Day 49’s compile already removed some of the launches a graph would have saved.
Post angle
Day 57 of building an LLM inference engine from scratch. I wrote the Week 13 acceptance test: two servers, same weights, same requests, one with CUDA graphs and one without, compare the tokens and the inter-token latency. It found that the graphed server had been handing requests another request’s history. Here is the mechanism, because it is a nice one. A recorded graph holds addresses, not values. Two of the things it holds are the persistent input buffers, which a step writes in batch order (row 0 is the first request in this step), and the read rectangle, which is a window slots[:rows] on the slot table, in cache row order starting at row zero. Those are the same index only while the scheduler’s rows are (0, 1, … n-1). Now run two requests of different lengths. The short one finishes, its row goes back to the pool, and the survivor stays where it was, in cache row 1, because nothing moves a running request. The batch is one row. The replay reads cache row 0. Right kernels, right shapes, stable addresses, warm graph, wrong sequence, no exception. The reason no earlier test caught it: every one of them held a batch still, and a request running alone sits in cache row zero, which is the one batch shape a misaligned replay gets exactly right. My own first version of the acceptance test compared answers from a pass where each client ran alone, and it passed. The fix is one tuple comparison (rows == (0, 1, ... n-1)), and a step that fails it runs the forward instead of replaying. Then the interesting number: how often does that happen? Uniform generation lengths, 100% of steps replay. Two lengths at 8 slots, 45%. Four lengths at 8 slots, 26%. A quarter. More slots makes it worse. This is why vLLM and SGLang keep a persistent batch with compacted rows, which I had read as a scheduler detail and is actually the precondition that makes a capture list worth having. That is tomorrow. 1740 green.