Day 59: the rectangle the read builds, and the tile that replaces it
Date: 2026-09-15 · Week 14 · Phase 5 Benchmark and optimize
What I added today
paged_attention_batched_kernel, and the two numbers that say what it is for.
The day I planned was the one Day 58 pointed at: graphbench.py --weights ./weights --device cuda --rates 1,2,4,8, both arms on a card, ITL p50 and p99 apart. This box has no card. torch.cuda.is_available() is False on a CPU-only build and there is no nvidia-smi, so that run is not deferred by choice and it is not done. It is the first thing to run on hardware, unchanged. What I did instead is the other half of the same paragraph, the part that needs no device because it is a question about shapes.
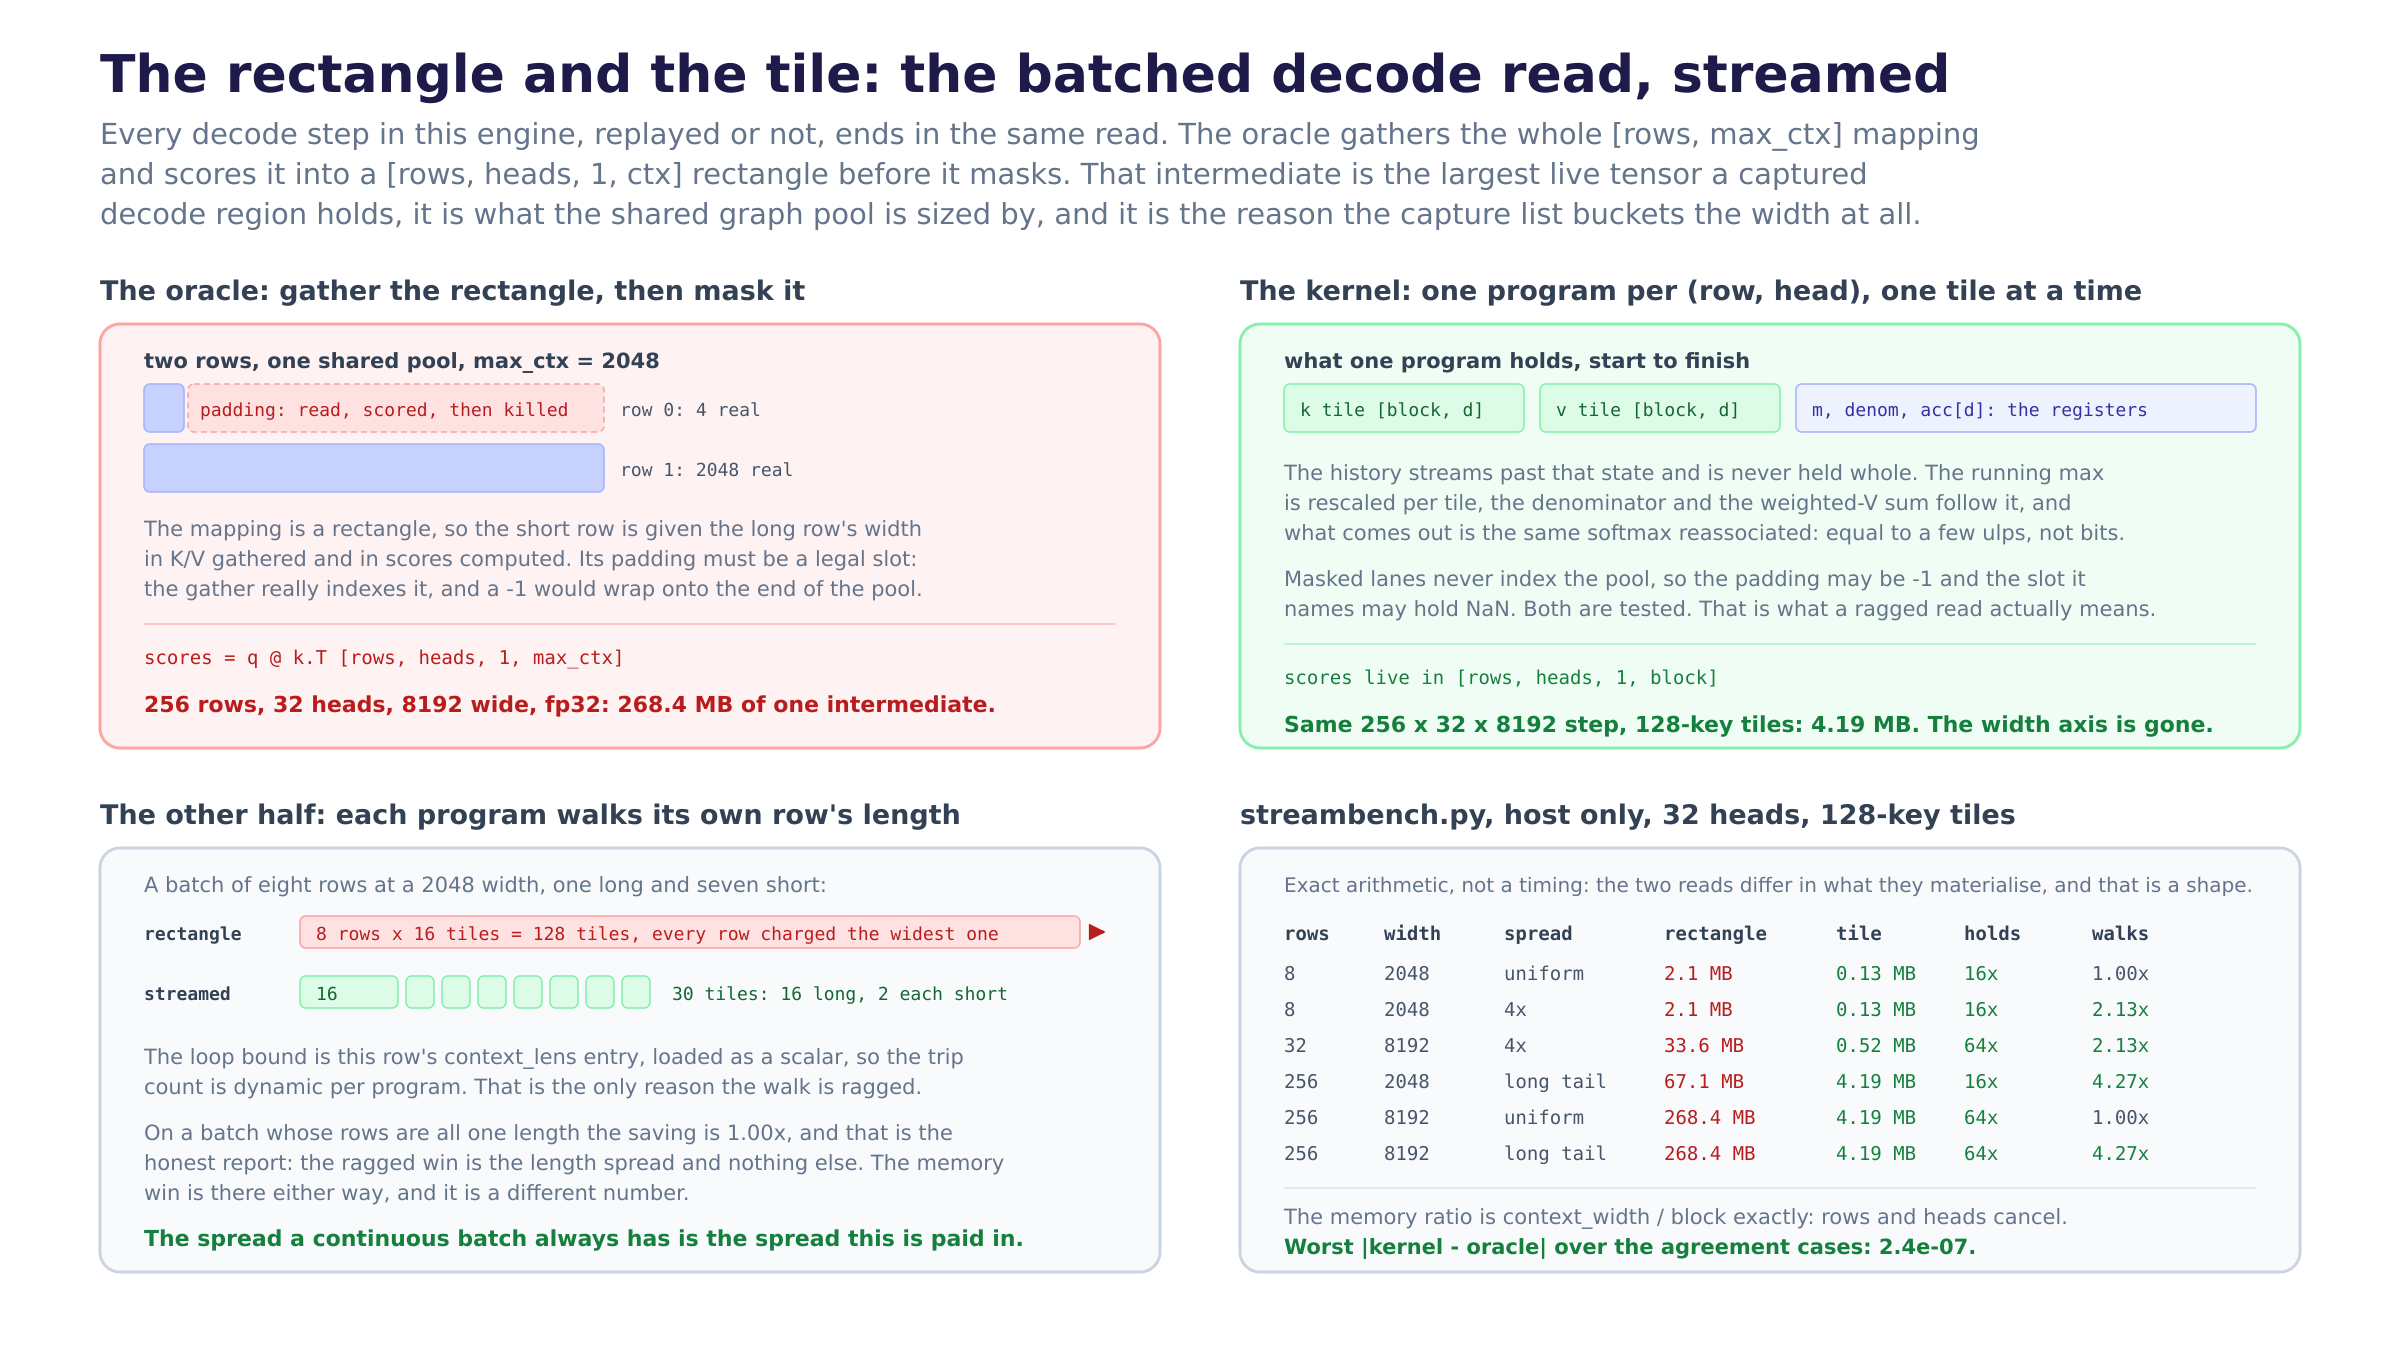
paged_attention_batched_reference has been the decode read since Day 28 and it has been honest about being the slow path the whole time. It gathers the entire [batch, max_ctx] mapping into K/V and scores that into a [batch, heads, 1, max_ctx] rectangle before it masks. That rectangle is the tensor Day 54’s workspace_bytes prices, it is what the shared graph pool is sized by, and at 256 rows, 32 heads and an 8192-token width it is 268.4 MB of one intermediate.
The kernel is the Day-22 single-sequence streaming loop one axis wider, on the same tlsim primitives, with a 2-D launch grid over (row, query head) because that is the grid vLLM’s paged kernel launches. One program owns one row’s one head, reads that row’s context_lens entry as a scalar, walks cdiv(ctx, block) tiles of its own history and folds each into an online softmax. Its whole live state is a [block, d] K tile, the same of V, a running max, a denominator and a d-wide accumulator. None of those has max_ctx in it. Every refusal the oracle makes it makes too, including Day 50’s validated/context_bounds pair, because a kernel that accepts inputs its oracle rejects cannot be compared to it.
StreamedWork and streamed_work count the other half: tiles walked against the tiles a rectangle of the same width implies, plus wasted_tiles and ragged_saving. streamed_score_cells, streamed_workspace_bytes and workspace_saving go into captured.py next to score_cells and workspace_bytes, so the two answers to “what does a decode step hold” sit in one place and can be read against each other.
tests/test_batched_kernel.py is 45 tests, test_captured.py gains 6. Suite 1858 green (5 GPU-gated skips), ruff clean.
streambench.py, host only, no weights (day-59-streambench.csv):
the streamed batched read, 32 heads, 128-key tiles:
  uniform    3 rows: worst |kernel - oracle| 2.38e-07
  ragged     4 rows: worst |kernel - oracle| 2.38e-07
  scattered  3 rows: worst |kernel - oracle| 2.38e-07

 rows  width     spread    rectangle       tile   holds   walked  rect tiles  walks
    8   2048    uniform       2.1 MB    0.13 MB     16x      128         128  1.00x
    8   2048         2x       2.1 MB    0.13 MB     16x       96         128  1.33x
    8   2048         4x       2.1 MB    0.13 MB     16x       60         128  2.13x
    8   2048  long tail       2.1 MB    0.13 MB     16x       30         128  4.27x
    8   8192    uniform       8.4 MB    0.13 MB     64x      512         512  1.00x
    8   8192  long tail       8.4 MB    0.13 MB     64x      120         512  4.27x
   32   8192         4x      33.6 MB    0.52 MB     64x      960        2048  2.13x
   32   8192  long tail      33.6 MB    0.52 MB     64x      480        2048  4.27x
  256   2048  long tail      67.1 MB    4.19 MB     16x      960        4096  4.27x
  256   8192    uniform     268.4 MB    4.19 MB     64x    16384       16384  1.00x
  256   8192  long tail     268.4 MB    4.19 MB     64x     3840       16384  4.27x
Why it matters
The saving is context_width / block exactly, and writing that down changed what I think the day is worth. rows, heads and query_len appear identically in both terms and cancel. So the streamed read does not help more on a big batch and does not stop helping on a small one: it is a property of the width axis alone. That is a narrower claim than “the kernel saves memory” and it is a much more useful one, because the width axis is the one Day 52 had to bucket. A capture list over batch sizes and widths is 36 shapes; over batch sizes alone it is 6. The reason vLLM’s list is one axis is not that they chose a coarser grid, it is that their read has no width to specialise on.
268.4 MB becomes 4.19 MB, and the pool sharing I was proud of on Day 54 saved 5x. Those two numbers are about the same tensor, and they are not the same size of achievement. Sharing one graph_pool_handle across the whole capture list took the arena from about five of the largest shape down to one of it. Replacing the rectangle with a tile takes that one down by another 64x. The optimisation I could do in an afternoon with a pool handle was real and it was the second-order term; the first-order term was the read all along, sitting behind a docstring that said “reference, not the fast path” since Week 6.
The ragged walk is a second saving and it is paid in exactly the thing continuous batching creates. The rectangle gives every row the longest row’s history, so a batch of eight rows where one has 2048 tokens and seven have 256 walks 128 tiles of which 98 are padding. The kernel walks 30. That spread is not an unlucky workload, it is what a server always looks like: requests arrive at different times and finish at different lengths, which is the same fact Day 58 spent the whole day compacting rows over. One property of a real batch has now cost me two days and paid me twice.
A masked load is a stronger statement than a mask, and the difference is testable. The oracle indexes the pool with the whole rectangle and kills the result afterwards, so its padding has to be a legal slot: the Day-28 docstring says a -1 would wrap onto the end of the pool rather than erroring. In the kernel the offsets are neutralised before they index, so the padding may be -1 and the slot it names may hold NaN. I wrote both as tests because they are the two ways to say “that load did not happen” in a form that fails if it did, and because a poisoned pad slot is the only test of skipping that an output comparison cannot fake: a value that contaminates everything it touches either got read or it did not.
The uniform row of the table says 1.00x and it stays in the table. A batch whose rows are all the same length has nothing ragged to skip, so the walk saving is exactly nothing there. It would be easy to drop that row and report the long-tail column as the result. It is the row that says what the saving is: the memory win is unconditional and the walk win is the length spread, and a reader who cannot see the 1.00x cannot tell those apart.
What I learned
- The expensive tensor was never the one I was optimising. Days 52 through 56 are all downstream of the score rectangle: bucket the width because the rectangle grows with it, share the pool because the rectangle is most of it, warm the list because there are 36 shapes of it. Every one of those was the right thing to do given the read, and none of them asked whether the read had to build the rectangle.
- “Reference, not the fast path” is a docstring that stops being read. It has been at the top of
paged_attention.pysince Week 6 and it is accurate. Six weeks of work went past it, including a whole week spent on the memory the reference spends, and the sentence that named the cause was sitting there the entire time in a file I opened often. A known limitation that is written down is not the same as a known limitation that is tracked. - The grid is
(row, head)and the reason is the accumulator, not the parallelism. My first instinct was one program per row, all heads at once, which is how the single-sequence kernel does it. That kernel keeps[n_q, d]of accumulator in registers and gets away with it becauseseq_qis small. Per row per head, the state is oned-wide vector, and the heads share nothing but the slot lookup anyway since each reads its own KV head’s channels out of the tile. - The dynamic loop bound is the entire ragged claim, and it is one line.
ctx = int(load(len_buf, ...))thenfor b in range(cdiv(ctx, block)). Everything else in the kernel would work perfectly well walking a fixedmax_ctxand masking the tail, and it would be wrong in exactly the way the rectangle is wrong: correct output, paid for at the longest row’s length. - Counting the tiles in a helper and counting them in the loop are two claims, so they need to meet.
streamed_workis host arithmetic and the loop is the kernel, and nothing structural forces them to agree. The last test in the file runs both on the same lengths for that reason. Without it the accounting is a story about the kernel rather than a measurement of it, and the bench table would be the place the story got told. - I could not run today’s planned day and the useful response was not to wait. The CUDA measurement needs hardware this box does not have, and the number it produces is the headline of the whole optimisation phase. The half of Day 58’s pointer that was about shapes needed no hardware at all, and it turned out to be the half that found the bigger number. The GPU run is still first in the queue and it is now measuring an engine with one more thing in it.
- vLLM’s paged kernel and their capture list are the same design decision. I have been treating those as two things I read about separately. The list is over batch sizes because the kernel has no width axis to specialise on, and the kernel has no width axis because it accumulates over tiles instead of materialising a row. Reading the second one explains the first, and I had them filed as unrelated tricks.
Diagram
streamed-paged-read.png. Left top is the oracle: the rectangle both rows are charged, the padding that really is read, and the 268.4 MB. Right top is one program’s entire live state and the 4.19 MB it replaces that with. Left bottom is the ragged walk, 128 rectangle tiles against 30 streamed ones, and the one line that makes it ragged. Right bottom is the measured table with the uniform rows left in.
Tomorrow
The kernel matches the oracle and nothing calls it. Day 60 is the wiring: BatchedPagedKVCache.paged_attention picks the read, streamed_read=False by default because a tlsim loop in Python must not become the serving path by accident, and the acceptance test is the one that matters, since a read swapped under a live engine has to produce the same bytes through the socket. Then the capture question this opens, which is the real prize and probably a day of its own: with no width in the read, the capture list is over batch sizes only, so DecodeBuckets loses an axis and goes from 36 shapes to 6. That is a smaller list, a smaller pool and a shorter warm-up, and all three fall out of a read that never builds the rectangle. The honest caveat stays: none of this is fast until the loop is Triton, and none of it is measured until there is a card under it.
Post angle
Day 59 of building an LLM inference engine from scratch. I planned to run my CUDA graph benchmark on real hardware today and could not, because the box has no GPU, so I did the other thing yesterday’s notes pointed at and it found a bigger number than the one I was chasing. Every decode step in my engine ends in the same read, and that read gathers the whole [rows, max_ctx] block-table mapping and scores it into a [rows, heads, 1, ctx] rectangle before it masks. At 256 rows, 32 heads and an 8192-token context that single intermediate is 268 MB. I have spent a week optimising around it: bucket the context width so the capture list is finite, share one memory pool across all 36 graphs, warm them at startup. All correct, all downstream of the rectangle. So today I wrote the read that never builds it. One program per (row, head), which is the grid vLLM’s paged kernel uses, walking that row’s own history a tile of keys at a time and folding each tile into an online softmax: running max, running denominator, running weighted-V sum, flash-attention style. Live state is one [block, d] tile plus three accumulators. Same step, 128-key tiles: 4.19 MB. The saving is context_width / block exactly, because rows and heads appear in both terms and cancel, and that is the sharper version of something I had read about and not understood: vLLM’s capture list is over batch sizes only, not because they chose a coarser grid, but because their read has no width axis to specialise on. There is a second saving I did not go looking for. The rectangle charges every row the longest row’s history, so eight rows with one long and seven short walk 128 tiles of which 98 are padding; per-row streaming walks 30. That spread is exactly what continuous batching creates, which is the same fact I spent yesterday compacting rows over. The test I am happiest with: fill the padding slots with NaN. The oracle cannot survive it, because it really does read them and then mask the result. The kernel never issues the load. 1858 green.