Day 32: the acceptance test, both loops on one clock
Date: 2026-08-02 · Week 8 · Phase 3 Batching and scheduler
What I added today
The other half of batchbench.py. Day 29 measured static batching and handed Week 8 a target; Day 31 built the loop that is supposed to hit it; today is the part where the claim gets measured instead of asserted. time_continuous_run is the mirror of time_batched_decode, with one timed callable per iteration rather than per step, because under continuous batching there is no separable prefill phase to hold out of a denominator, only iterations in which some rows happened to be new. ContinuousTiming records the two things a static run structurally cannot: the batch size of every iteration, which is a constant there and a variable here, and the iteration each request finished in, which turns “the batch is done” into “this request is done” and is the entire latency argument of the week.
compare_batching puts a BatchTiming and a ContinuousTiming side by side and refuses the pairing unless both runs collected the same tokens for the same requests. That refusal is the function. It splits its answers into counts that travel (work_ratio, waste_removed) and times that do not (makespan_speedup, mean_latency_speedup, first_answer_speedup, goodput_speedup), because the first pair holds on any box and the second pair is a statement about this one. build_continuous_run wires the closures to a real Day-31 Engine, and compare_model_batching runs one workload both ways back to back under one clock. Forty-one new tests in tests/test_batchbench_continuous.py, the same two halves as the static side: a fake clock and scripted outcomes for every number, then a real engine over a tiny model to pin that the harness collects exactly what Engine.generate emits. Suite 390 green (5 GPU-gated skips), ruff clean.
Why it matters
The Day-29 shape, rerun: eight rows, a 5-token prompt each, seven of them wanting 4 tokens and one wanting 32, on Llama-3.2-1B in fp32 on this CPU.
| static | scheduled | |
|---|---|---|
| token-slots computed | 256 | 60 |
| tokens collected | 60 | 60 |
| waste fraction | 79.0% | 0.0% |
| makespan | 70.3s | 17.2s |
| first answer | 70.3s | 8.7s |
| mean latency | 70.3s | 9.8s |
| goodput (end to end) | 0.85 tok/s | 3.49 tok/s |
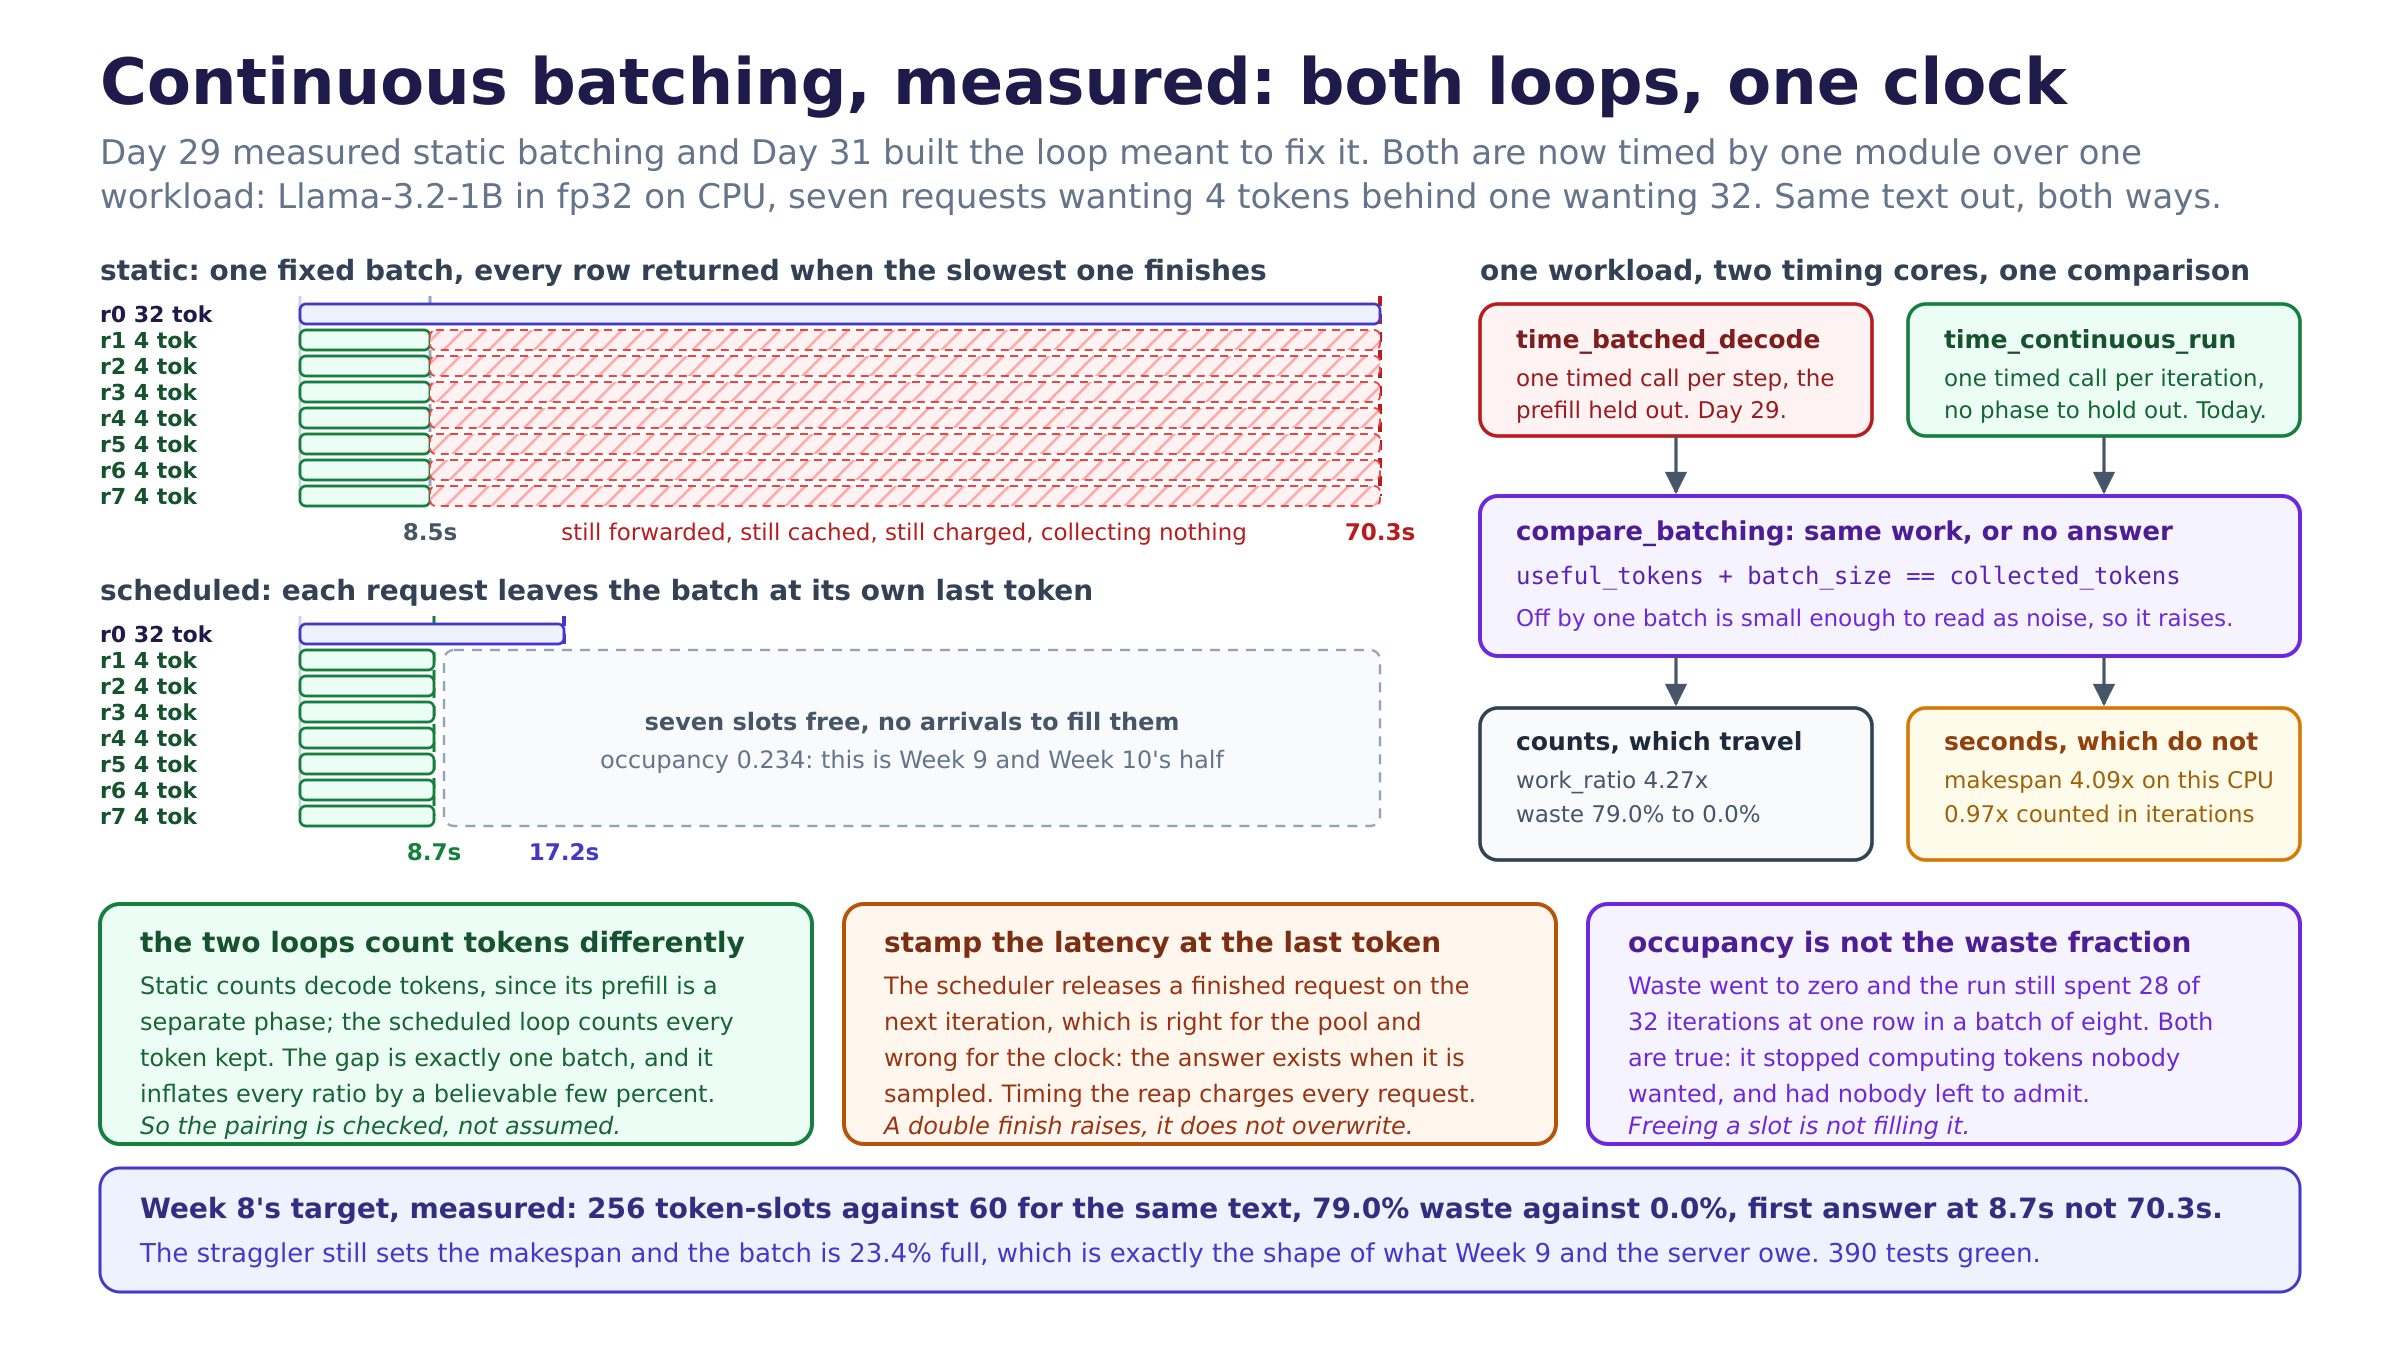
The two counts are the durable result: 4.27x the forward work for identical text, and the 79% waste is gone rather than reduced, because a row is in the batch only while it still wants a token. The latency column is the one a caller feels. Static batching has one number in it because a fixed batch is returned as one object, so every row’s latency is the straggler’s, 70.3s; the scheduled loop hands the short rows back at 8.7s and the straggler at 17.2s, which is 8.1x sooner for the first answer and 7.2x on the mean.
The wall-clock half of that is honest about the box and not about the design. A 4.1x makespan win is real here and it is mostly this CPU: Day 29 measured a batch-8 decode step at 2092ms against 279ms at batch 1, so shrinking the batch to one row makes each forward roughly 7x cheaper. On a card, where the weights leave HBM once per step whatever the batch, a single-row step costs nearly what an eight-row step costs, the makespan barely moves, and the win is entirely latency plus the seven rows now free for somebody else. The counting version of the same caution is in the harness: under a unit clock, where every iteration costs the same, makespan_speedup on this shape is 0.97, since the engine spends one extra iteration reaping the last request. Continuous batching is not a makespan optimisation and the benchmark should not be allowed to imply that it is.
The number that says what is still missing is occupancy, 0.234. After iteration 4 the seven short requests are gone and the engine runs a batch of one for 28 iterations, and nothing fills those rows because this is a closed set of eight requests with no arrivals. Continuous batching frees slots; it does not fill them. Filling them takes a queue with something in it, which is what Week 10’s server provides, and a pool that can admit from that queue, which is what Week 9 owes: running the same eight requests through a pool sized for four reservations gives 41 iterations at occupancy 0.188, with the 3-block request stuck behind the worst-case reservations of requests that will never use them.
What I learned
- The two loops count tokens differently, and the difference is exactly one batch.
BatchTiming.useful_tokensis decode tokens only, because its prefill is a separate timed phase that emitted one token per row;ContinuousTiming.collected_tokensis every token any request kept. Comparing them directly understates the static side bybatch_sizeand inflates every ratio by a few percent, which is small enough to look like measurement noise and survive review.compare_batchingassertsuseful_tokens + batch_size == collected_tokensand raises otherwise, so the pairing is checked rather than assumed. The same discipline forcedend_to_end_goodput_tpsonto the static timing: a rate over the decode alone compared against a rate over a whole loop is two different questions with one name. - Separate the counts from the times, in the type and not just the prose. Every ratio this module can produce is one of two kinds. A count of rows and tokens is a property of the schedule and holds on any hardware; a ratio of seconds is a property of where this box sits between bandwidth and FLOPs. Today they disagree loudly, 4.27x on work against 0.97x on iterations against 4.09x on wall clock, and all three are correct answers to different questions. A benchmark that reports one headline speedup has quietly picked one and hidden the other two.
- A latency has to be stamped at the last token, not at the reap. The scheduler releases a finished request on the next iteration, which is right for the pool, since nothing may be freed while a forward could still be reading it, and wrong for the clock, since the answer exists the moment its last token is sampled. Timing the release would have charged every request one extra iteration, systematically, in the direction that makes the engine look worse. So the runner reports the ids that reached a terminal state during the iteration, and the timing core rejects a request that reports finishing twice, because the second stamp silently overwrites the first with a later one.
- Occupancy is the metric that shows what the week did not do. Waste fraction went to zero, which reads as finished, and the run still spent 28 of 32 iterations at one row in a batch of eight. Both are true: the engine stopped computing tokens nobody wanted and it did not start computing tokens somebody did, because there was nobody to admit. A dashboard with only
waste_fractionon it would show a solved problem on a box running at a quarter of its width, and telling the two reasons for a low occupancy apart, a drained queue or a pool held by worst-case reservations, is the whole of what Week 9 has to fix.
Diagram
continuous-vs-static.png. Left is the same eight-row timeline Day 29 drew, twice: the static batch with its finished rows hatched to the straggler’s end at 70.3s, and underneath the scheduled run where each short row stops at 8.7s and the batch narrows to a single row for the rest. Right is the harness itself, the two timing cores feeding one compare_batching that refuses any pairing whose collected tokens do not match, with the token check written out. The three boxes are the day’s cautions (counts travel and seconds do not, stamp the latency at the last token, occupancy is not waste), and the banner is the result: 256 token-slots against 60 for identical text, 79.0% waste against 0.0%, the first answer at 8.7s instead of 70.3s, and a batch that is 23.4% full and waiting for a queue.
Tomorrow
Week 9 opens on the debt every one of these numbers points at. Admission still reserves worst_case_tokens, so the pool is booked for text nobody will generate and a waiting request is refused blocks that are sitting empty. The first step is incremental allocation: give a running request one block at a time as it crosses a boundary, which means a decode step can now discover the pool is dry mid-flight, which means the RUNNING to WAITING edge that Day 30 deliberately left out of the transition table finally has to exist. Preemption by recompute (drop the blocks, put the request back at the head of the queue, prefill it again later) is the simplest policy that makes that edge safe, and vLLM’s choice between recompute and swap is the thing to read carefully first. The measurement to hold it to is on this page: the same eight requests through a pool sized for four should stop leaving rows idle behind reservations, and occupancy is the number that says whether it worked.
Post angle
Day 32 of building an LLM inference engine from scratch. Week 8’s scheduler is only worth what its measurement is worth, so today the continuous loop got timed by the same harness that convicted static batching on Day 29, on the same eight requests: seven wanting 4 tokens, one wanting 32. Static computes 256 token-slots to collect 60 and hands every row back at 70.3s. Scheduled computes 60 to collect 60 and hands the short rows back at 8.7s. Same text, 4.27x less forward work, first answer 8.1x sooner, and the 79% waste is 0.0% rather than a smaller number, because a row is in the batch only while it still wants a token. Three things I would have got wrong without writing the comparison as code. First, the two loops count tokens differently: static counts decode tokens because its prefill is a separate phase, continuous counts everything a request kept, and the gap is exactly one batch, small enough to pass for noise. The comparison now refuses to pair two runs whose collected tokens do not match. Second, my 4.1x wall-clock win is mostly this CPU. A smaller batch is a cheaper forward here (2092ms at batch 8, 279ms at batch 1), but on a card the weights leave HBM once per step whatever the batch, so the makespan would barely move and the win would be latency plus seven rows freed for someone else. Counted in iterations the makespan speedup is 0.97x, and that is the honest headline: continuous batching is not a makespan optimisation. Third, the number that says what is missing: occupancy 0.234. The engine spent 28 of 32 iterations running one row in a batch of eight, because a closed set of 8 requests has nobody left to admit. Continuous batching frees slots, it does not fill them. That is what Week 9 (preemption, incremental allocation, the thing vLLM does that I still do not) and Week 10’s server are for. 390 green.