Day 24: the scaling fit, reading the exponent off the sweep
Date: 2026-07-14 · Week 6 · Phase 2 Paged memory
What I added today
ScalingFit and fit_scaling in src/nanoserve/readbench.py, plus a report_scaling readout wired into the readbench.py runner. Day 20 built the microbenchmark and printed a table: gather and fused timed at 16, 64, 256, 1024, 4096 tokens of history. A table of five numbers per path does not answer the one question the kernel exists to change, which is whether the curve is flat or climbing. fit_scaling reads that off the points. It fits t = c * L**p by ordinary least squares in log-log space and reports three things: the exponent p (the empirical big-O of the read), the seconds-per-token at the longest history (the absolute cost the slope hides), and a one-word regime (flat, sublinear, linear, superlinear) that bands the exponent for a glance.
The fit is pure and the tests pin it to closed-form series. A perfectly linear t = c*L returns exponent 1.0 to the float; a constant t = c returns 0.0; an L**2 blow-up returns 2.0; a sqrt(L) returns 0.5 and classifies sublinear. The guards are the interesting part: fewer than two points has no line, fewer than two distinct lengths has no slope (a vertical line), and a non-positive length or a zero best-of has no logarithm, so each raises rather than feeding a NaN into the exponent where it would silently poison the regime. Eight new tests in tests/test_readbench.py, all pure. Suite 184 green (5 GPU-gated skips), ruff clean.
Why it matters
The whole Week-6 story is “the paged read is O(history) and the kernel bends that down,” and until today the repo asserted the first half and hand-waved the second. Running the real sweep is honest about where it actually sits. From 64 to 4096 tokens both gather and fused fit exponent about 1.15, squarely linear, and their per-token costs are within a percent of each other. That is not a disappointment, it is the measurement doing its job: on CPU both paths do an O(history) index gather through torch, so of course they share a slope. The fused read is not asymptotically better than the gather, and a benchmark that pretended otherwise would be lying. The win the streaming kernel buys is a smaller constant, not a smaller exponent: same O(L) work, far less memory moved, no contiguous history materialized. The flat line people quote for flash-style attention is a memory-bandwidth effect on a GPU, and the instrument to read it off is now sitting in the runner waiting for a card to run the kernel on. Separating the slope from the constant is the point; the slope is where the algorithm lives and the constant is where the hardware does.
What I learned
- A slope is a scale-free number and a constant is not. The log-log fit gives the same exponent whether the times are seconds or milliseconds, because scaling every
tby a constant only shifts the log-log intercept, never the slope. That is why the exponent is the honest cross-machine number and the per-token cost is the one that carries a unit and only means something next to the box it was measured on. I put both on the readout so neither gets quoted alone. - At short histories the constant impersonates a flat slope. Run the sweep at 8, 32, 128 and the fit reads exponent about 0.36, which looks sublinear and is entirely the fixed per-call overhead (projection, softmax setup) diluting the real O(L) term. Push the sweep out to 4096 and the same read climbs to 1.15. The asymptote only shows up once the history is long enough to dominate the floor, so a scaling claim from a short sweep is a claim about the overhead, not the algorithm.
- The guards are the fit, not decoration. Least squares over one point, over one distinct length, or over a zero best-of does not fail loudly, it returns a NaN or an infinity that flows straight into the regime word and reads as a confident “flat.” A microbenchmark’s degenerate case is exactly the
min_s == 0.0thatspeedupalready guards, so the fit has to guard the same boundary. A number an instrument cannot honestly produce should raise, not round.
Diagram
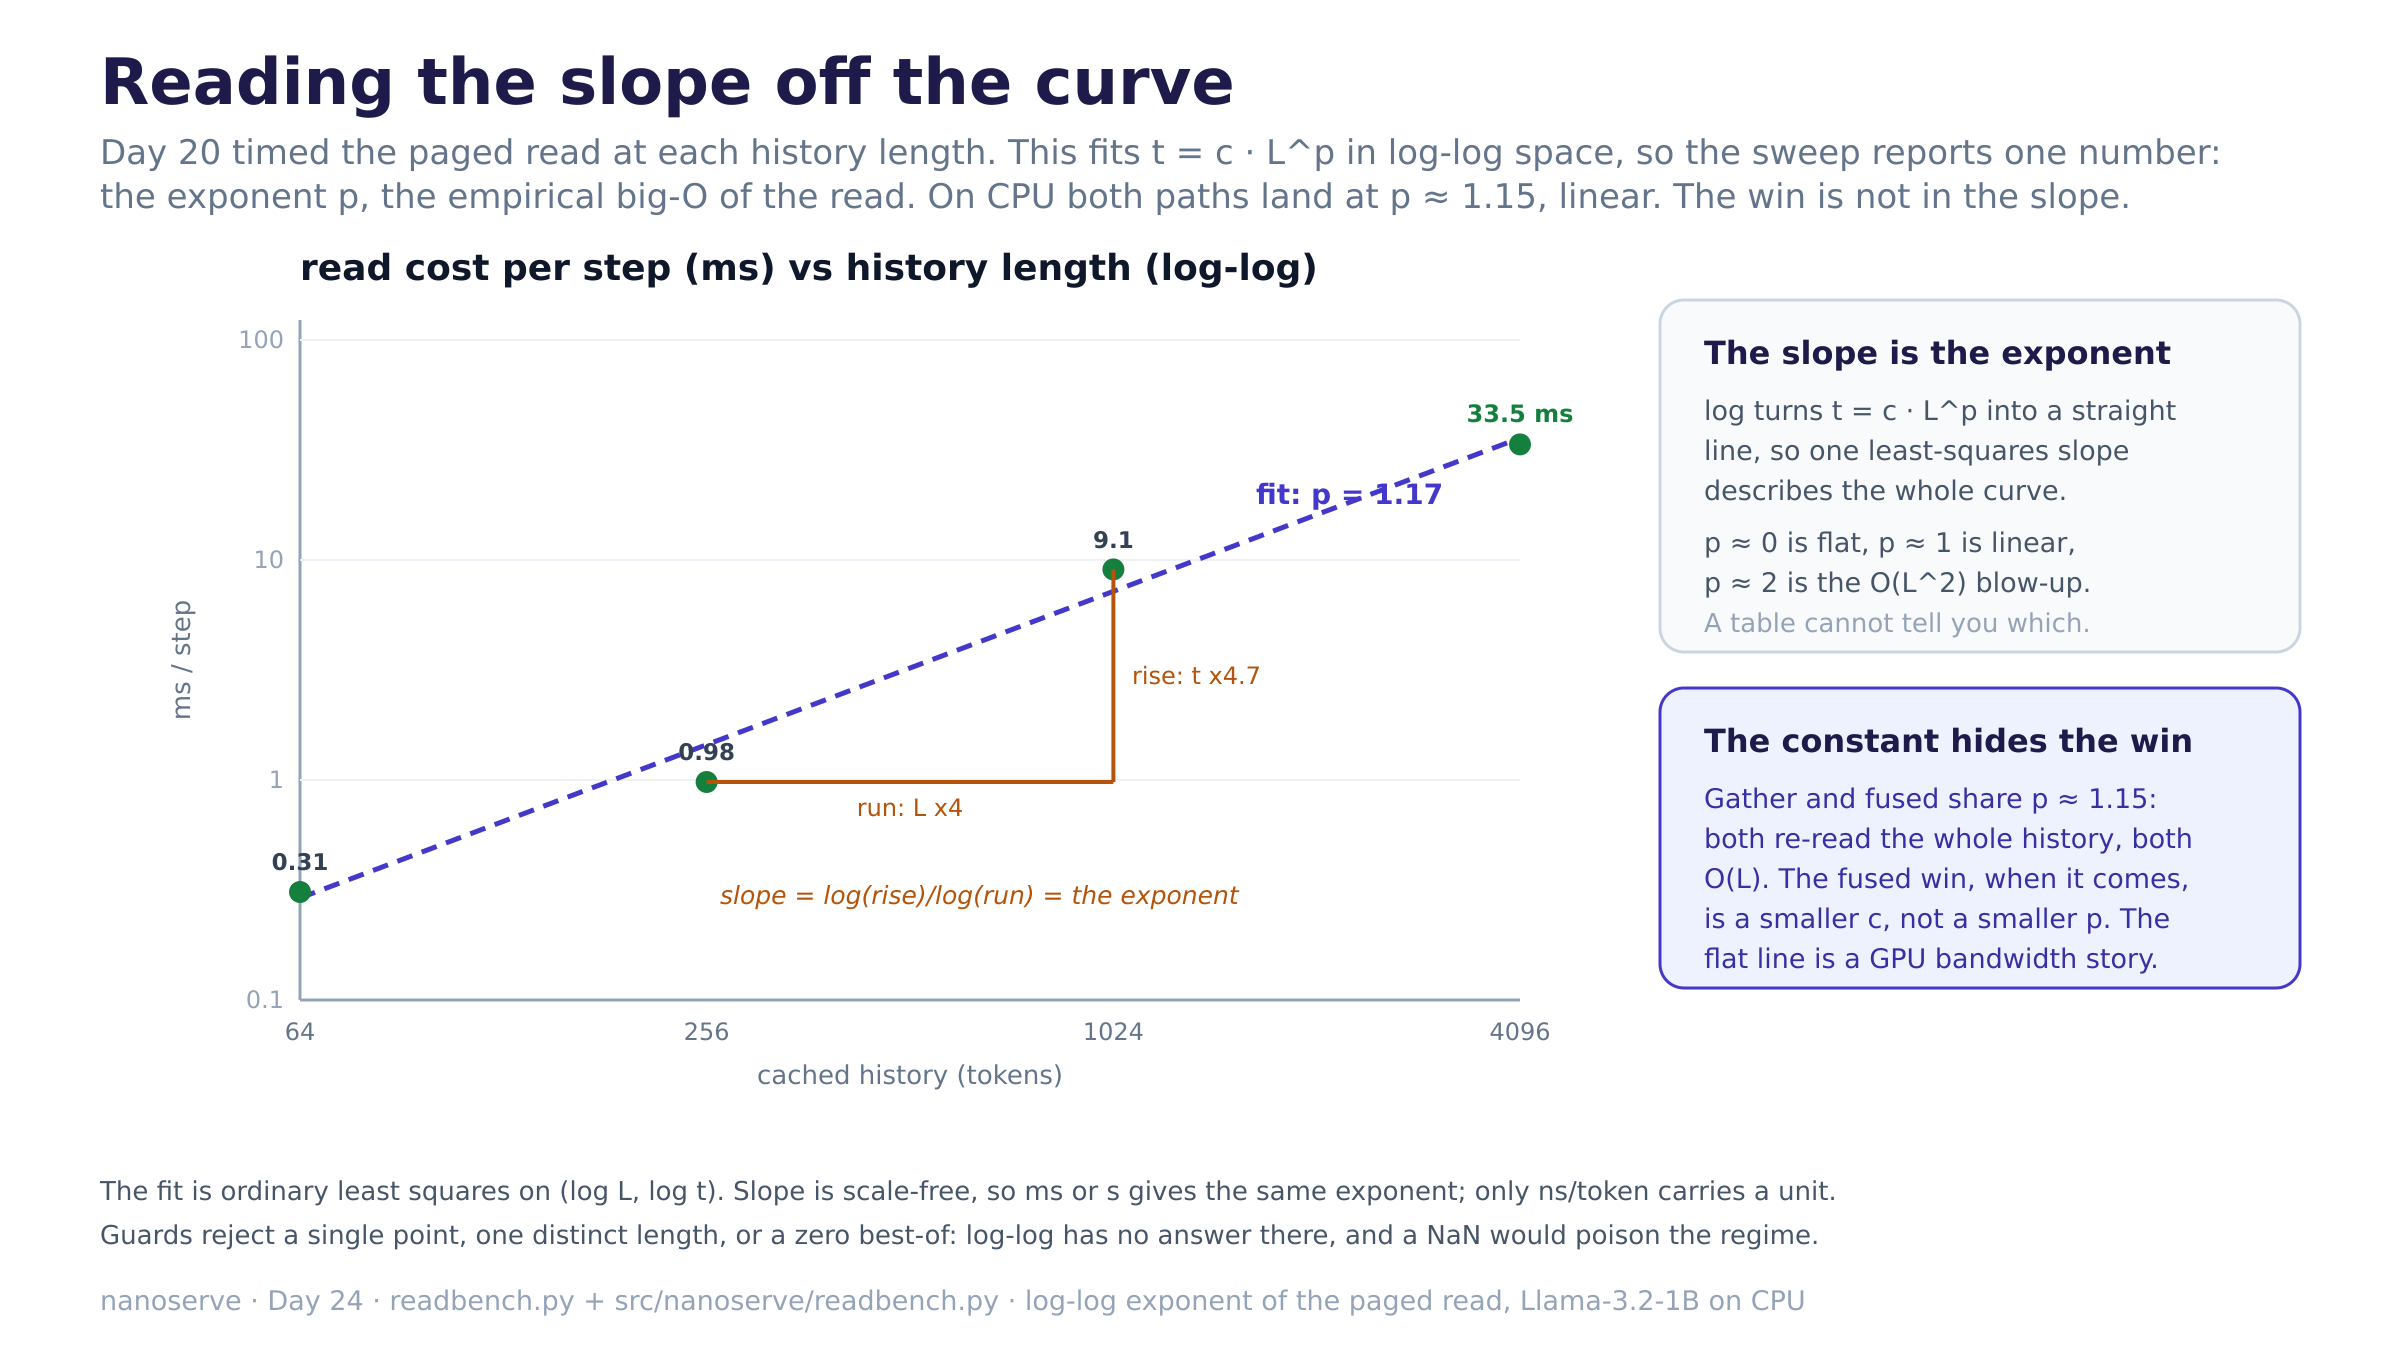
read-scaling-fit.png. The log-log plot with the four measured points and the least-squares line through them, its slope annotated as the exponent: a run of 4x the history against a rise of 4.7x the time is a slope of about 1.15, which is what “linear” looks like once you take the log of both axes. The right panels say what the fit says. The slope is the exponent, and log turns a power law into a straight line so one number describes the whole curve. The constant is where the win hides, because gather and fused share the slope and only a card running the kernel moves the line, and it moves the constant, not the exponent.
Tomorrow
Wire the dispatcher into the model path. PagedKVCache.paged_attention still calls paged_attention_reference directly, the exact torch oracle; the Day-23 paged_attention dispatcher (Triton on a card, the tlsim model on CPU) is only called from tests. Route the cache’s fused read through select_backend so the engine uses the kernel on a GPU and the correct-and-slow model everywhere else, which is the last wiring step that turns Week 6 from a kernel in a file into the engine’s real attention. The reference stays as the oracle the dispatch is checked against, not as the path the model runs.
Post angle
Day 24 of building an LLM inference engine from scratch. I finally ran the paged read benchmark for real instead of asserting what it would say, and the honest result is more interesting than the tidy one. The plan was “gather is linear in the history, the fused read is flat.” I built the instrument to prove it: fit t = c * L**p in log-log space, because taking the log of both axes turns a power law into a straight line and the slope is the exponent, the empirical big-O. From 64 to 4096 tokens both paths fit p about 1.15. Both linear. They tie. That is not the benchmark failing, it is the benchmark being honest: on a CPU both reads do an O(history) index gather through torch, so they have to share a slope. The fused read was never asymptotically faster. Its win is a smaller constant, same O(L) work with far less memory moved and no contiguous history rebuilt, and the flat line people quote for flash-style attention is a GPU memory-bandwidth effect, not a change in the exponent. The nice part is that the fit separates the two: the slope is where the algorithm lives and the constant is where the hardware does, and you cannot see either from a table of five numbers. One gotcha that cost me a second look: at short histories the same read fits p about 0.36 and looks flat, which is entirely the fixed per-call overhead diluting the real term. The asymptote only appears once the history is long enough to dominate the floor. This is the shape vLLM and SGLang measure their kernels in, slope apart from constant, and the instrument is now waiting in the runner for a card to run the kernel on. 184 green.