Day 56: the flags reached the launcher, and the graph limit was a width
Date: 2026-09-12 · Week 13 · Phase 5 Benchmark and optimize
What I added today
The boot path. Six days of work sat behind flags nothing turned on: build_engine did not pass bucket_decode, persist_inputs or capture_decode through, so a server started from serve.py ran the Day-47 eager loop with Weeks 12 and 13 switched off. Now it threads all three plus capture_recorder, unchanged and unbundled, because Engine.build refuses two out of three and a launcher should not soften that.
nanoserve.launch gains the second sizing decision. CapturePlan is KVPoolPlan’s sibling: the list, max_rows, max_width, width_bound_by, full_count, budget_bytes and limit, with count, trimmed, widest, pool_bytes, as_dict and describe. plan_capture builds it from four numbers that arrive from four places, width_from_limit is the new one of the four, and warm_engine walks Day 55’s warm_decode behind three gates. boot_info is the /health payload with the capture decision nested under cuda_graphs rather than merged, and boot_lines is what serve.py prints. The gates are check_warm_before_serving, check_capture_matches_cache, check_capture_limit and check_boot_info, over two new refusals, CaptureTooSmall and BootUnsound.
build_app puts three steps between the engine and the app and their position is the day: plan the list after the pool, warm after that, and construct the AsyncEngine after that. serve.py gets --cuda-graphs (one flag, three switches, which is allowed at the CLI and nowhere below), --no-warm, --warm-rows and --warm-width, and prints two boot lines where it printed one. AsyncEngine.running already existed; it has a second reader now and says so.
tests/test_boot.py is 62 tests. Suite 1671 green (5 GPU-gated skips), ruff clean.
bootbench.py, host only, no weights, priced at 50 ms a graph (day-56-bootbench.csv):
what a deployment asks for, against a 64-graph limit:
 slots  context  rows x widths  wanted  over  ceiling  kept  startup    arena
     8     2048      4 x 16         64     0     2048    64    3.20s    2.0 MB
     8     4096      4 x 32        128    64*    2048    64    3.20s    2.0 MB
    16     2048      5 x 16         80    16*    1536    60    3.00s    3.0 MB
    16     8192      5 x 64        320   256*    1536    60    3.00s    3.0 MB
    32     4096      6 x 32        192   128*    1280    60    3.00s    5.0 MB
    64     8192      7 x 64        448   384*    1152    63    3.15s    9.0 MB
   256     8192      9 x 64        576   512*     896    63    3.15s   28.0 MB
and the other side of that trim, per request generating to the full context:
 slots  context  ceiling  lazy captures  in a client's latency  saved at startup
     8     2048     2048              0                  0.00s             0.00s
     8     4096     2048             16                  0.80s             3.20s
    16     2048     1536              4                  0.20s             1.00s
    16     8192     1536             52                  2.60s            13.00s
    32     4096     1280             22                  1.10s             6.60s
    64     8192     1152             55                  2.75s            19.25s
   256     8192      896             57                  2.85s            25.65s
Why it matters
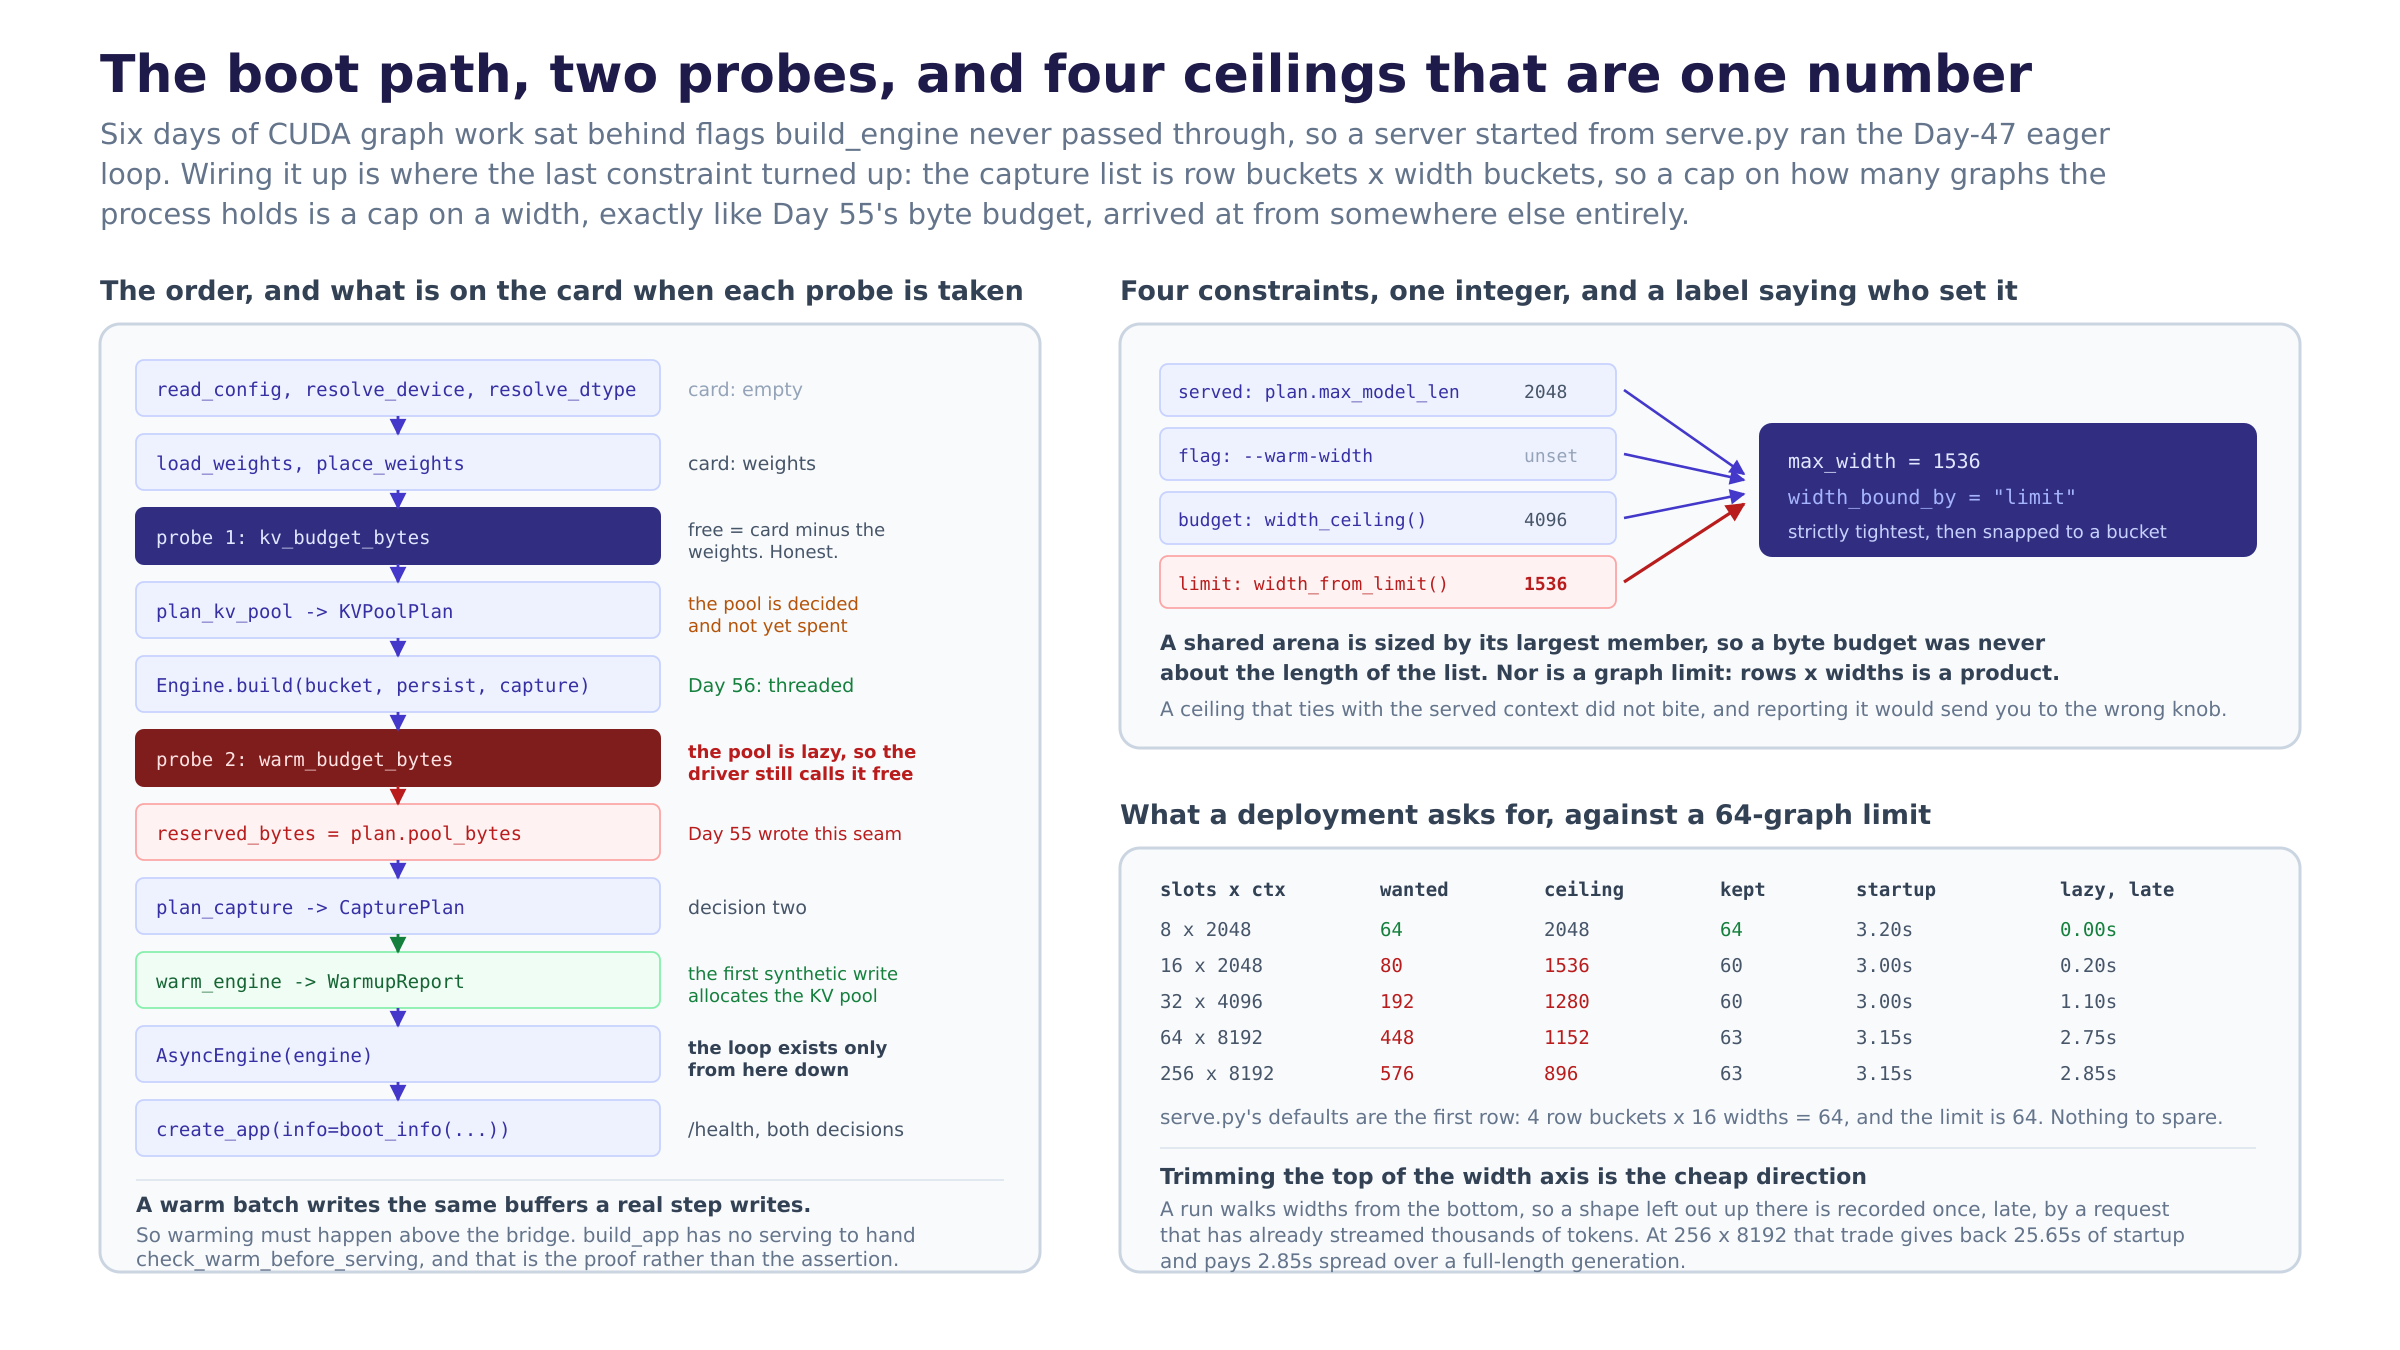
The graph limit is a statement about a width, and I did not see that coming. Day 55 ended on “a byte budget does not trim the length of the capture list, it caps the widest shape in it”, because a shared arena is sized by its largest member. Today the process’s own DEFAULT_CAPTURE_LIMIT turned out to be the same kind of statement arrived at from a completely unrelated direction: the list is row buckets x width buckets, so a cap on the count is a cap on how far up the width axis it may go. The served context, an operator’s flag, a byte budget and a graph limit are four constraints with nothing in common, and all four reduce to one integer. CapturePlan therefore has one ceiling and a width_bound_by field naming who set it, which is the only part of the boot line anybody will read twice.
The default deployment sits exactly on the limit. serve.py’s defaults are 8 slots and 2048 tokens: 4 row buckets x 16 widths = 64 shapes, and the limit is 64. Nothing to spare. The first flag anybody reaches for is --max-batch-size 16, which adds one row bucket, multiplies the list by 5/4 and puts it 25% over, and the width is what gives because the count is a product and a deployment cannot move the other factor without changing what it sells. I would not have found this by reading the code. I found it by making a table of the shapes somebody would actually type.
Trimming the top of the width axis is the cheap direction, and the table says so in both currencies. Every row of the second table saves more startup than it moves into latency, and the ratio is not close: 256 slots at 8192 tokens gives back 25.65 seconds of boot and pays 2.85 seconds spread over a request that generated 8192 tokens. The reason is where on the axis the dropped shapes are. A run walks the width axis from the bottom, so a shape left out at the top is recorded once, late, by a request that has already streamed thousands of tokens, and a shape left out at the bottom would be recorded in the first seconds of every request the server ever answers. That asymmetry is the whole argument for truncating rather than sampling, and it is also why the truncation is in whole rows: keeping half a row would leave a hole at exactly the context where the scheduler admits one more request.
The budget has to be asked for after the pool and it has to be told about it anyway. plan_capture probes the card a second time, which is the point of it being a second call. But the K/V pool is allocated lazily, on a layer’s first write, and the first write in a warmed process is a synthetic row’s throwaway K/V. So at plan time the driver cannot see the pool and would report every byte of it as free, and a capture list sized against that number is a list that fits until the moment the pool lands under it. plan.pool_bytes goes in as Day 55’s reserved_bytes, which is exactly what that parameter was written for, one day before there was a caller who needed it.
The ordering rule has a gate and build_app cannot reach it. A warm batch writes the same persistent decode buffers a real step writes, so a warm-up taken while the AsyncEngine loop is running is two writers on one address and the symptom is a token, not a traceback. check_warm_before_serving refuses it. The interesting part is that build_app has no serving to pass: it warms before the bridge is constructed, so the correct order is the only order it can express. A gate nobody in the repo can trip is usually a gate that should not exist; this one is the exception, because the caller it is for is the next person to wire a process by hand.
Two sizing decisions are published, nested, and one of them can lie. /health grows a cuda_graphs section rather than more flat keys, because flattened, max_width would sit next to max_model_len and invite the reading that one is derived from the other when in fact they are a promise to a caller and a memory ceiling that happen to share a unit. check_boot_info refuses the payload that says the capture is warm while some shape is cold, which is the one lie a health check can tell here that nothing else in the process would notice: a cold shape is not an error, it is a recording that has not happened yet and will happen in front of whoever asks for that context first.
What I learned
- Two unrelated constraints collapsing onto the same knob is a sign the knob is the real variable. The byte budget became a width ceiling yesterday and the graph limit became one today, by a completely different argument. When that happens the design is telling you what the free parameter actually is, and the right move is to stop carrying four numbers and carry one plus a label saying who set it.
- A ceiling has to be snapped to a bucket before it is reported. A budget that buys 300 tokens of context buys the 256 bucket, and a plan whose
max_widthsays 300 names a width no graph in the list was recorded at. It also matters for comparing the four candidates at all: they only sit on the same axis once they are all in the same units. One line, and I only wrote it because a test asserted the number a reader would check. - A ceiling that ties with the default did not bite. The first version reported
width_bound_byas whichever candidate achieved the minimum, and a flag set to exactly the served context came back as “flag”, sending a reader to a knob that changed nothing. Strict improvement fixes it, and the general lesson is that a field explaining why a number is what it is has to be about causation and not about which branch of aminhappened to run. - The defaults were one row bucket away from a boot failure and nobody would have known.
CapturedDecoderefuses past its limit, which mid-warm-up means a boot that dies on the 65th shape after paying for 64 recordings. Asking the question at plan time is a division. The finding is not that the limit is wrong, it is that a product of two integers a user picks will cross any fixed cap eventually, and a process that holds a fixed number of anything has to be able to say what it will do when asked for more. - Lazily allocated memory is invisible to a probe, and a boot order full of probes has to account for what has been decided but not yet spent. The pool is planned, sized and agreed to at a point where the driver still reports its bytes as free. This is the same class of mistake as Day 38’s duplicated embedding: nothing raises, the numbers are all individually correct, and the total is wrong.
- The right proof that an order is safe is an API that cannot express the other one. I wrote
check_warm_before_servingfirst and then noticedbuild_apphad nothing to hand it. The instinct was to construct theAsyncEngineearlier so the check had a subject. The better read is that there was nothing to check, because the object that could make it unsafe does not exist yet, and that is a stronger property than a passing assertion. - A CLI may bundle flags that a constructor must not.
--cuda-graphssets three things, andEngine.buildstill refuses two out of three by name. An operator asking for CUDA graphs means all three and should not have to know that a capture over an open shape set is not a slower engine but a wrong one. Putting the convenience one layer above the refusal keeps both. - Wiring days find the constraint that the component days could not. Nothing in Days 52 to 55 could have told me the default deployment sits exactly on the capture limit, because none of them knew what
serve.py’s defaults were. The number only exists where the flags meet.
Diagram
boot-order.png. Left is the boot path top to bottom with what is resident on the card at each step, and the two probes marked at the two moments they are taken, with reserved_bytes drawn as the pool that has been decided and not yet spent. Right top is the four ceilings collapsing into one width, with width_bound_by as the label that survives. Right bottom is the deployment table: the list each shape wants against the list the limit allows, and the trim priced in both directions.
Tomorrow
The graphs are reachable from the command line and nothing has measured them through a socket. Day 57 is the Week 13 acceptance test: servebench against a server launched with --cuda-graphs and one launched without, on the real card, reporting inter-token latency at p50 and p99 rather than a mean, because a capture’s whole claim is about launch overhead per step and a warm-up’s whole claim is about a tail. Two things I expect to be wrong about. One is that the numbers will be smaller than the arithmetic says, because the Day-49 compile is already collapsing some of the launches a graph would have saved, and the honest comparison is three-way rather than two. The other is /health: it reports what the boot decided and nothing about what the loop has done since, so a server whose trimmed list is quietly recording at the top of the width axis, or worse, falling through to eager, looks identical to one that is replaying everything. check_all_shapes_captured and check_replays_dominate have existed since Day 54 and no running process has ever been asked either.
Post angle
Day 56 of building an LLM inference engine from scratch. Boring day on paper: six days of CUDA graph work sat behind flags that build_engine never passed through, so a server started from the CLI ran the old eager loop. Wiring. Except the wiring is where the last constraint was hiding. Day 55 ended on a nice line: a byte budget does not trim the length of a capture list, it caps the width of the widest shape in it, because a shared memory arena is sized by its largest member. Today the process’s own graph limit turned out to be the same statement by a completely different route. The list is row buckets x width buckets, so a cap on how many graphs you hold is a cap on how far up the width axis the list may go. Four constraints (the context you sell, an operator’s flag, the bytes left on the card, the graphs the process will hold) and all four are one integer. Then the table. serve.py’s defaults are 8 slots and 2048 tokens: 4 row buckets x 16 widths = 64 shapes, and the default capture limit is 64. Exactly on the line. --max-batch-size 16 adds one row bucket, multiplies by 5/4, and overruns. Something else fell out of pricing the trim in both currencies: dropping the top of the width axis is nearly free. A run walks widths from the bottom, so a shape left out up there is recorded once, late, by a request that already streamed thousands of tokens. At 256 slots and 8192 tokens that trade gives back 25.65s of startup and pays 2.85s spread across a full-length generation. The subtle bug I nearly shipped: the capture budget probes the card after the KV pool is planned, but the pool is allocated lazily, on first write, so the driver still reports every byte of it as free. vLLM and SGLang both do this capture pass at startup; doing it myself is how I learned that “ask the driver what is free” has a precondition nobody writes down. 1671 green.