Day 43: the time to first token, taken apart from the inside
Date: 2026-08-24 · Week 12 · Phase 5 Benchmark and optimize
What I added today
nanoserve.latency: RequestTimeline, one per request, stamped as its life happens; TimelineBroken for a life that could not have happened; LatencyReport and summarize for a window of them; and percentile, moved down here from Day 42’s servebench because both sides of the socket now need the same nearest-rank rule and the scheduler cannot import a module that imports an HTTP client. The wiring is four lines in three files: Scheduler.add_request stamps the queue, Request.transition_to stamps admission, preemption and the finish, Request.append_token stamps the first token, and AsyncEngine keeps a bounded window of finished timelines behind latency_report() with four of its numbers in stats(), so /health reports them too. tests/test_latency.py is 35 tests in three tiers: the arithmetic on a hand-moved clock, the report, and the wiring over the real scheduler, engine and bridge. Suite 794 green (5 GPU-gated skips), ruff clean.
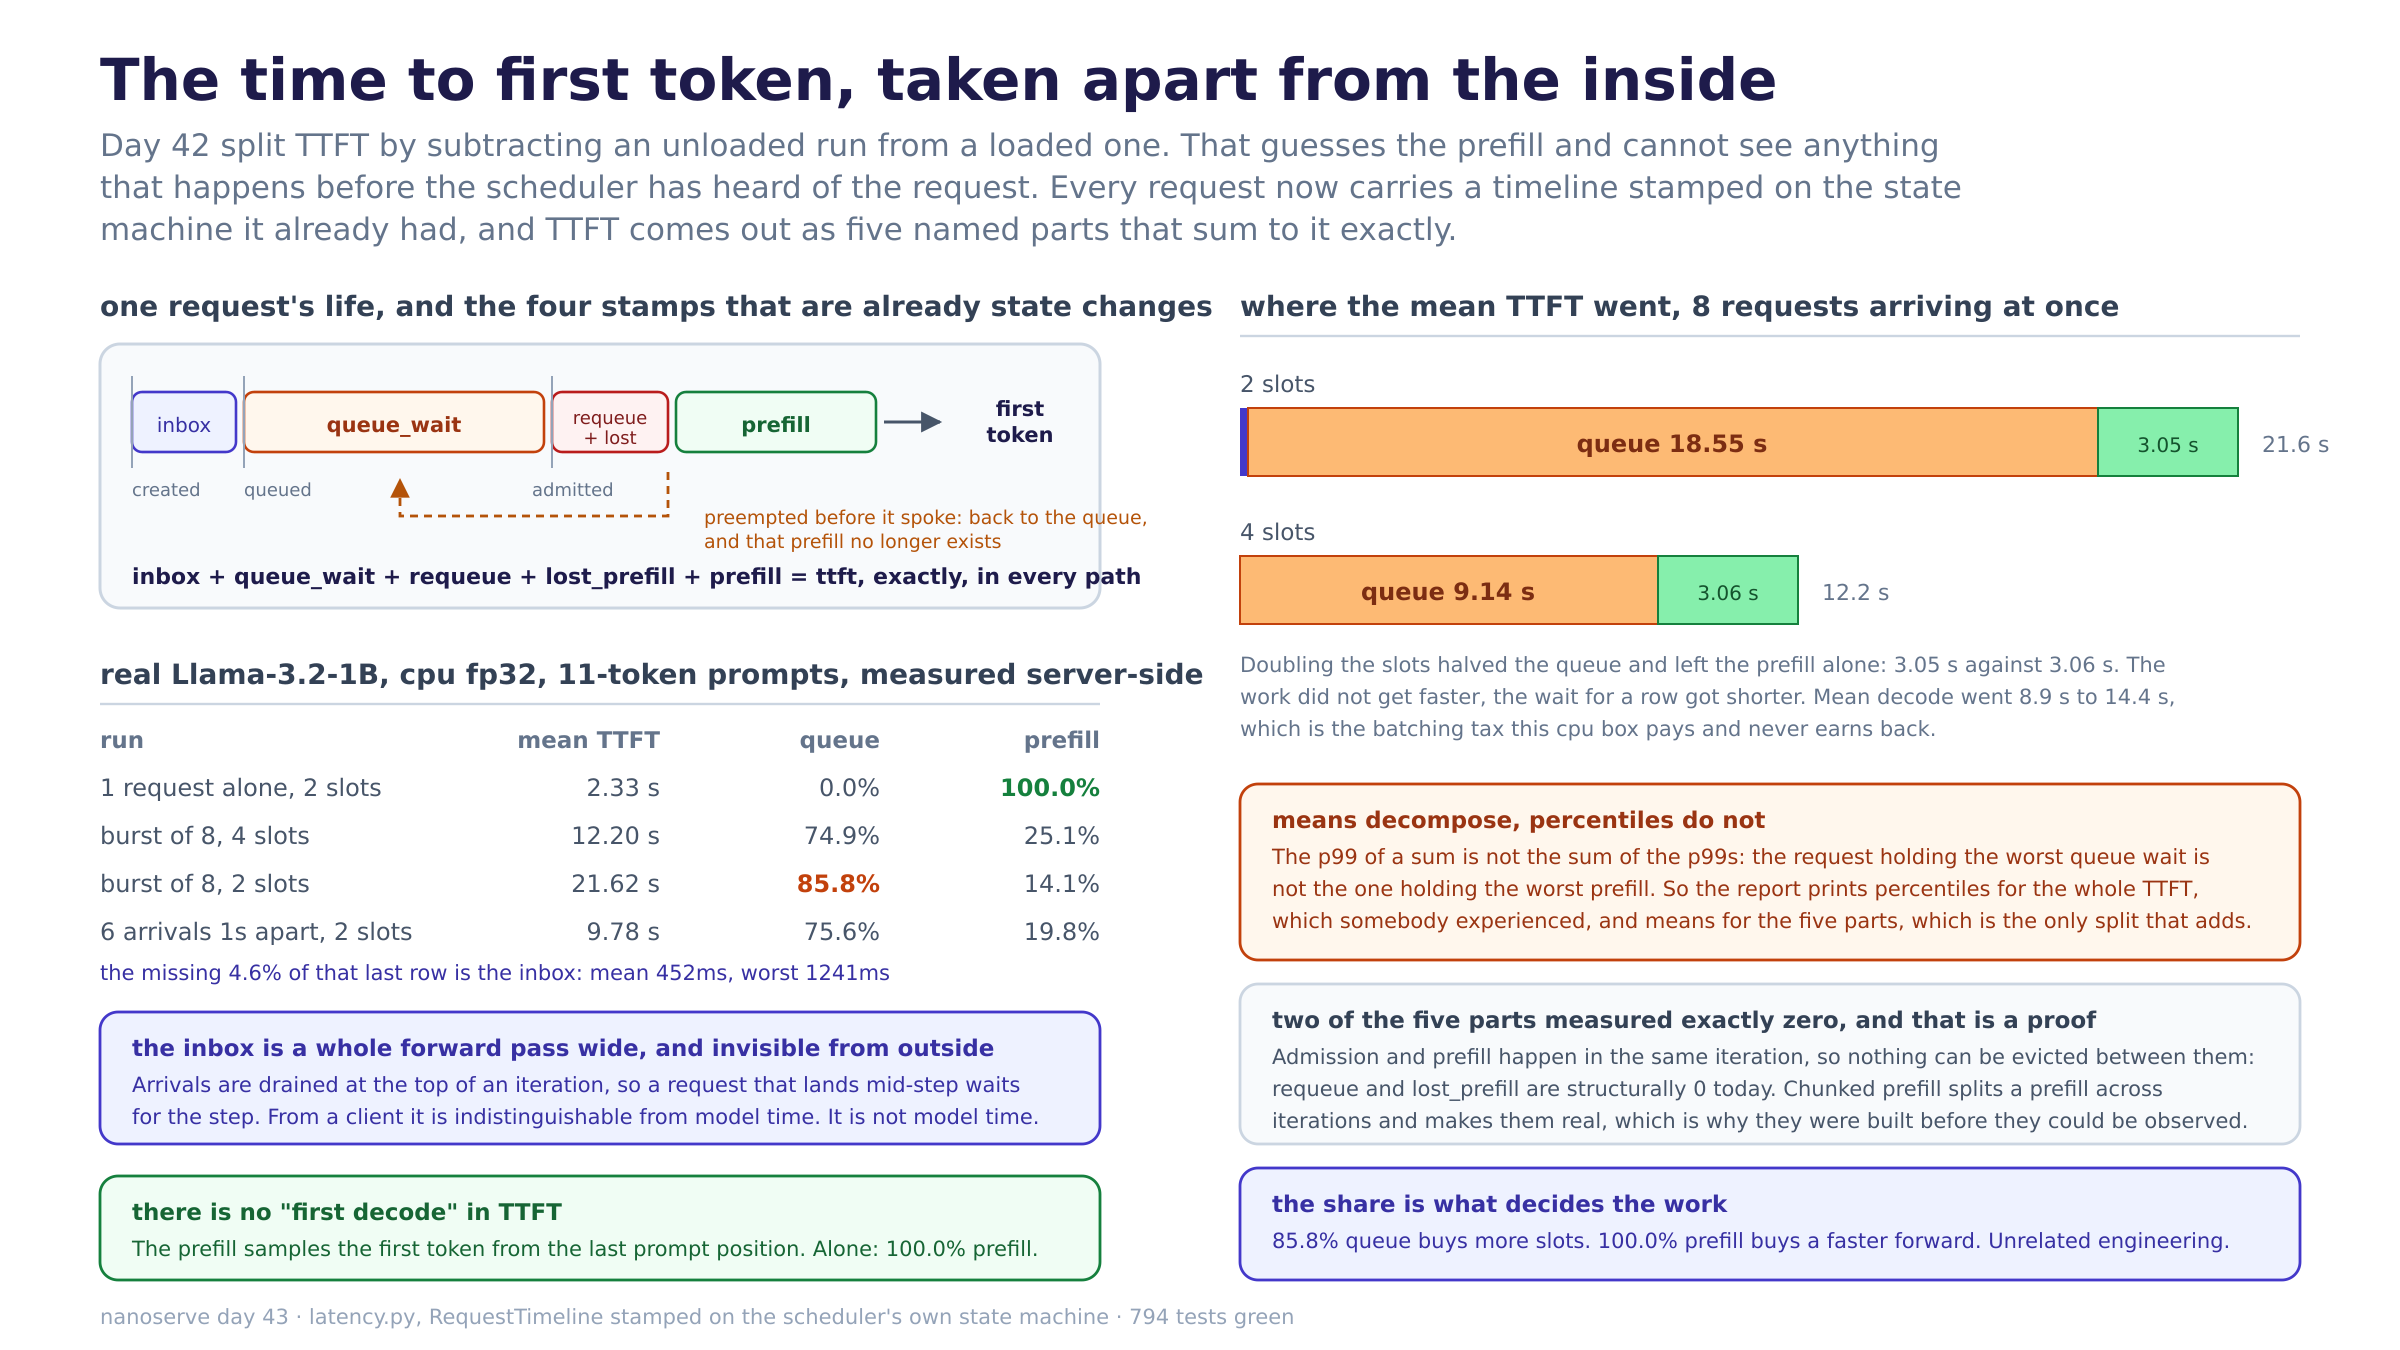
TTFT comes apart into five parts that sum to it exactly:
created --inbox--> queued --queue_wait--> admitted --prefill--> first token
                      ^                      |
                      \--- requeue ----------/  (+ lost_prefill)
The real Llama-3.2-1B, cpu fp32, 11-token prompts, measured server-side:
run                            mean TTFT   inbox    queue   prefill
1 request alone, 2 slots           2.33s    0.0%     0.0%    100.0%
burst of 8, 4 slots               12.20s    0.0%    74.9%     25.1%
burst of 8, 2 slots               21.62s    0.0%    85.8%     14.1%
6 arrivals 1s apart, 2 slots       9.78s    4.6%    75.6%     19.8%
and the same 8 requests at two batch sizes, which is the shape of the day:
2 slots   queue 18.55s   prefill 3.05s   ttft 21.62s   decode mean  8.89s
4 slots   queue  9.14s   prefill 3.06s   ttft 12.20s   decode mean 14.40s
Why it matters
Day 42’s split was a subtraction, and a subtraction is not a measurement. Yesterday’s headline, that 93% of the wait at overload is the wait for a slot, came from taking a loaded request’s TTFT and subtracting an unloaded one’s. That assumes the unloaded number is the loaded request’s prefill, and today’s numbers say it is not: in the 2-slot burst the measured prefills were 1.98s, 2.14s, 3.59s and 4.50s for the same eleven-token prompt, a 2.3x spread, because a prefill is a padded rectangle whose cost depends on who else was admitted in the same iteration and what the box was doing at the time. A single subtracted constant would have been wrong by up to two seconds per request in both directions, and it would have put the error in the queue column, which is the column the decision is made from.
The share is what decides the work, and the shares are far apart. 100.0% prefill alone on the box, 85.8% queue in a burst against two slots. Those two numbers ask for completely unrelated engineering: the first is a faster forward pass (Week 13’s whole agenda, torch.compile, CUDA graphs, kernel work), the second is more slots or a bigger pool, and neither one moves the other’s number at all. Doubling the slots is the experiment: the queue halved, 18.55s to 9.14s, and the prefill did not move, 3.05s against 3.06s. Nothing got faster; the wait for a row got shorter. A latency budget that cannot tell those apart sends a week of optimisation at the wrong half.
The inbox is a real component and it was invisible yesterday. A served request is built in an HTTP handler and put on a deque; the loop drains that deque at the top of an iteration, because that is the one instant when nothing is mid-forward and there is exactly one writer. So a request that arrives while a step is running waits for the whole step before the scheduler has heard of it. Measured, with arrivals a second apart against a busy 2-slot server: mean 452ms, worst 1241ms, 4.6% of TTFT. From outside the process that time is inside TTFT and looks exactly like model time. It is not model time, no forward pass optimisation touches it, and the only reason it is small here is that this box’s forward is slow enough that a second between arrivals usually lands in a gap. On a fast card with a short step it would be a smaller number; on any box it is a number the client cannot see and the server can.
There is no “first decode” in TTFT. Yesterday I wrote that the unloaded 1.64s was “the prompt’s prefill plus the first decode and nothing else”. The split says otherwise: alone on the box, TTFT is 100.0% prefill, 0.5ms of queue and 0.1ms of inbox. Engine._prefill samples from the last position of the prompt, so the forward that builds the K/V is the forward that produces token one, and the first decode step produces token two, which is an inter-token latency and not a TTFT component at all. It is a small correction and it matters because it says where the 2.33 seconds actually is: one padded rectangle over eleven positions, twice through sixteen transformer layers in fp32.
Means decompose and percentiles do not. The report prints percentiles for the whole TTFT and means for the five parts, and that asymmetry is deliberate. The p99 of a sum is not the sum of the p99s: the request holding the worst queue wait is generally not the one holding the worst prefill, so a “p99 breakdown” adds up to a latency no request had and usually overshoots the real p99. In the 2-slot burst the p99 queue is 38.56s and the p99 prefill is 4.50s; adding them gives 43.06s against a real p99 TTFT of 40.55s. Only the means are an identity, and the identity is the reason to trust the split at all.
What I learned
- Every moment worth timing was already an edge of the state machine. Day 30 built WAITING/RUNNING/FINISHED with one choke point,
transition_to, and Day 33 added the RUNNING -> WAITING edge. Three of the five parts are the durations of those states, so the stamps went insidetransition_torather than at the four call sites that trigger it. That is not tidiness: it means a future scheduling policy cannot add a code path that quietly stops being measured, which is the normal way instrumentation rots. The only stamp that is not a transition is the first token, and it is at the token rather than at the end of the forward, because the token is what the caller is waiting for. - Two of the five parts measured exactly zero, and that is a proof rather than a gap.
requeue_sandlost_prefill_sare the latency half of Day 33’s recompute bill, and they were 0.0 in every run, including the one where the pool was 8 blocks and the scheduler preempted twice. The reason is structural:schedulegrows before it admits, and the engine prefills the admitted set in the same iteration, so there is no instant at which a request has blocks and no first token. A request can only be evicted after it has spoken, and then the cost lands in decode. That stops being true the moment a prefill is split across iterations, which is what chunked prefill is, so the two parts were built before they could be observed and the day they go non-zero is a day with a diagnosis attached. n_preempted=2, waste_share=0.0is the report earning its keep. Those two numbers together say “the pool was too small, and it cost these callers decode time rather than time to first token”, which is a different complaint with a different fix than the same preemptions landing before the first token would have been. A report that folded preemption into one number could not say it.- Monotonic clock, and the numbers are deliberately not comparable to Day 42’s.
perf_counter, nottime.time, so a wall-clock correction under a long run cannot produce a negative queue wait. The cost is that these stamps mean nothing outside this process, which is correct, because every span here is a difference of two stamps taken by one server. The client’s TTFT is still larger thanttft_sby the socket, the tokenizer and the first SSE frame, and the honest way to use both is to subtract: server-side TTFT from client-side TTFT is everything the engine is not responsible for. - Batching moved the cost, it did not remove it. Going from 2 slots to 4 cut mean TTFT from 21.62s to 12.20s and pushed mean decode from 8.89s to 14.40s. The wall clock for all eight requests went 47.8s to 34.9s, so it was a real win, but the per-request experience is a trade and not a gift: everybody waits less to start and reads more slowly. That is Day 42’s flat-ITL finding from the other side, and on a card the decode half of it would be nearly free, which is the one sentence to keep attached to every number this box produces.
- The invariant is worth more than the numbers.
check()asserts three things: the stamps are ordered, the residency accounts for every second between creation and finish, and the parts sum to the whole. The measurement script calls it on every timeline it prints. A decomposition that only balances on the happy path hides exactly the runs worth looking at, and Day 35 already made the argument that an invariant nobody evaluates is a comment.
Diagram
ttft-split.png. Left top is one request’s life with the five parts and the preemption loop back to the queue. Left bottom is the measured table, plus the two findings the table alone does not say: the inbox, and the missing first decode. Right top is the same eight requests at two batch sizes, as stacked bars. Right bottom is the two rules, the two parts that are provably zero today, and what the share is actually for.
Tomorrow
Day 44 is the baseline the week is really for: the same prompts and the same box through HuggingFace generate, one request at a time because that is all it can do, against this engine’s numbers. Today’s split is what makes that comparison mean something rather than being two throughput numbers next to each other, since HF’s per-request latency is all prefill and decode with no queue in it at all, and the only fair statements are “this engine’s prefill against that one’s” and “this engine’s throughput at N concurrent against that one’s at 1”.
Post angle
Day 43 of building an LLM inference engine from scratch. Yesterday I split time to first token by subtracting an unloaded run from a loaded one and said 93% of the wait was queueing. Today I measured it properly from inside the server and the method was wrong even where the answer was roughly right. Every request now carries a timeline stamped on the state machine it already had, and TTFT comes apart into five parts that sum to it exactly: inbox, queue wait, requeue, lost prefill, prefill. Real Llama-3.2-1B on cpu. One request alone: 2.33s, and it is 100.0% prefill, 0.5ms of queue. Eight requests at once against 2 slots: 21.62s mean, 85.8% queue, 14.1% prefill. Same eight against 4 slots: 12.20s, and here is the part a subtraction could never have told me, the queue halved from 18.55s to 9.14s and the prefill did not move, 3.05s against 3.06s. Nothing got faster. The wait for a row got shorter. Three things I did not expect. The measured prefills for the same prompt varied 2.3x within one run, so the constant a subtraction assumes does not exist. There is no “first decode” in TTFT at all, because the prefill samples the first token from the last prompt position. And there is a component no client can see: arrivals are drained at the top of an iteration, so a request that lands mid-step waits for the whole step before the scheduler knows it exists. Measured at 452ms mean, 1241ms worst. That is not model time and no kernel work touches it. One rule I will not break: the report prints percentiles for the whole TTFT and means for the five parts, because the p99 of a sum is not the sum of the p99s. Here, p99 queue plus p99 prefill is 43.06s against a real p99 of 40.55s. 794 green.