Day 63: the tail became parallelism, and the wait became idle programs
Date: 2026-09-19 · Week 14 · Phase 5 Benchmark and optimize
What I added today
src/nanoserve/kernels/flash_decoding.py: the split decode read, as chunk arithmetic on the host, as two grids of tlsim programs, and as two triton.jit bodies.
Day 62 measured the thing this day is about and then said it could not fix it. A batched decode read launches one program per (row, query head), every program is resident, and the launch ends when its slowest one retires, so LaunchWork.imbalance is 4.27x on a long-tail batch: three quarters of the grid finished and waited for one row. The wait is structural rather than a scheduling accident, because a row’s online softmax is a sequential fold and the program holding four thousand tokens has four thousand tokens of serial work no matter how empty the card is around it.
Flash-decoding is the answer vLLM and SGLang ship, and it is one idea. Stop making one program own a whole row. Cut the history into fixed chunks, give each chunk its own program with its own running max, denominator and weighted-V accumulator, and reduce the partials in a second pass.
partition_width cuts the mapping’s width into chunks of whole tiles and refuses a keys_per_split that is not a multiple of the block. choose_splits picks the count from two bounds, the grid and the partition floor, and from the width rather than from the batch. SplitPlan / split_plan are the per-row, per-chunk tile counts and everything derived from them: wave_speedup, idle_programs, partial_bytes. reduce_partials is the second pass in plain torch, which is the oracle the second jitted body is held to. paged_attention_split_kernel is both passes as tlsim programs, held to paged_attention_batched_reference. _paged_attention_split_fwd and _split_reduce_fwd are the jitted bodies, and paged_attention_split is the dispatcher, Day 62’s exactly.
tests/test_flash_decoding.py is 59 tests (7 GPU-gated). Suite 2053 green (19 GPU-gated skips), ruff clean. One of today’s tests found that Day 62’s gated GQA test builds a ModelConfig with hidden_size=192 and 8 x 48 heads, which asserts on construction: it has never run on this box, so it has never failed. Fixed in passing.
Not wired to PagedRead. The split is a third read alongside the rectangle and the stream, and what it costs is a workspace a captured region cannot allocate per step.
splitbench.py, host only, no weights (day-63-splitbench.csv):
the split decode read on this box: backend tlsim (32 heads, 32-key tiles, 8192-wide mapping)
  asked 1 splits, launched 1 of 8 keys: worst |split - oracle| 3.58e-07
  asked 2 splits, launched 2 of 4 keys: worst |split - oracle| 2.38e-07
  asked 3 splits, launched 2 of 4 keys: worst |split - oracle| 2.38e-07
  asked 7 splits, launched 4 of 2 keys: worst |split - oracle| 3.58e-07

   rows     spread  splits  chunk  programs   tail    wave   idle   imbal      MiB
      1    uniform       1   8192        32    256   1.00x    0%   1.00x     0.02
      1    uniform       4   2048       128     64   4.00x    0%   1.00x     0.06
      1    uniform      16    512       512     16  16.00x    0%   1.00x     0.25
      8    uniform       1   8192       256    256   1.00x    0%   1.00x     0.13
      8    uniform      16    512      4096     16  16.00x    0%   1.00x     2.03
      8         4x       1   8192       256    256   1.00x    0%   2.13x     0.13
      8         4x       4   2048      1024     64   4.00x   50%   2.13x     0.51
      8         4x      16    512      4096     16  16.00x   53%   2.13x     2.03
      8  long tail       1   8192       256    256   1.00x    0%   4.27x     0.13
      8  long tail       4   2048      1024     64   4.00x   66%   4.27x     0.51
      8  long tail      16    512      4096     16  16.00x   77%   4.27x     2.03
     32  long tail      16    512     16384     16  16.00x   77%   4.27x     8.12

  choose_splits at 32 heads (target 2048 programs, 512-key floor):
   rows  unsplit      1024     4096     8192    32768
      1       32         2        8       16       64
      8      256         2        8        8        8
     32     1024         2        2        2        2
    256     8192         1        1        1        1
Why it matters
The split count has to come from the width, and that single choice is Day 49 and Day 61 arriving at the same answer from different directions. The obvious way to pick a split count is from the batch: look at the longest row, cut it into chunks of
- The longest row is a number inside a tensor, so asking for it is the readback Day 49 spent a day removing and the graph break that cuts a captured region in two. Worse than that, a split count derived from the batch is a different grid on every step, which is a different compiled kernel and a different graph, which is Day 61’s 576-entry capture list back again by another road. The width is a Python int the caller already has, and under Day 61’s streamed bucket set it is
max_model_lenfor the life of the process. Sochoose_splits(rows, n_q, context_width)never sees a tensor,SPLITSandKEYS_PER_SPLITaretl.constexpr, and the only thing that still varies per step is thetl.load(ctx_ptr + i)that was already varying yesterday.
The partition is in whole tiles, and it is a refusal rather than a convention. A program’s inner loop ramps arange(0, BLOCK_N) from its chunk’s start, so a chunk of 48 keys on a 32-key tiling would put split 1’s first tile halfway through split 0’s last one and both programs would fold the same keys into two different partials. The reduction has no way to notice: it would add them, the denominator would be too large by exactly the overlap, and the answer would be a plausible finite vector. So partition_width rounds a requested split count up to a tile boundary, and refuses a keys_per_split that is not a multiple of the block instead of rounding it, because rounding a chunk silently changes which keys a program reads.
The empty chunk is the case the whole design rests on, and it needs no branch. A split is a grid axis, so every row gets splits programs whether its history reaches them or not. A chunk that starts past its row’s end walks zero tiles, and it still has to store: pass two reads that workspace slot unconditionally, and a slot nobody wrote holds whatever the allocator left there. It stores -inf, 0, 0, and exp(-inf - M) is exactly zero for any finite M, so it drops out of both sums with no branch anywhere. The reduction never learns which chunks were real. The same arithmetic covers the BLOCK_S padding lanes in pass two, which load -inf and 0 for the same reason and take the same path.
The wave speedup is exactly the split count, and it is capped by the longest row and not by the width. Every wave in the bench is 1.00x, 2.00x, 4.00x, 16.00x: the tail really does shrink linearly, because cutting a row that spans every chunk gives every program the same cdiv(width_tiles, splits) tiles. What breaks the pattern is a row that does not reach. Cutting an 8192-wide mapping sixteen ways does nothing at all for a batch whose longest row is 1024 tokens, because the chunk is 512 and the other fourteen are empty, so the cap is the longest row’s tile count. That is the exact place Day 61 and Day 63 pull against each other: Day 61 rounds the width up to max_model_len so the capture list can lose an axis, and a split of that width is a split of mostly padding.
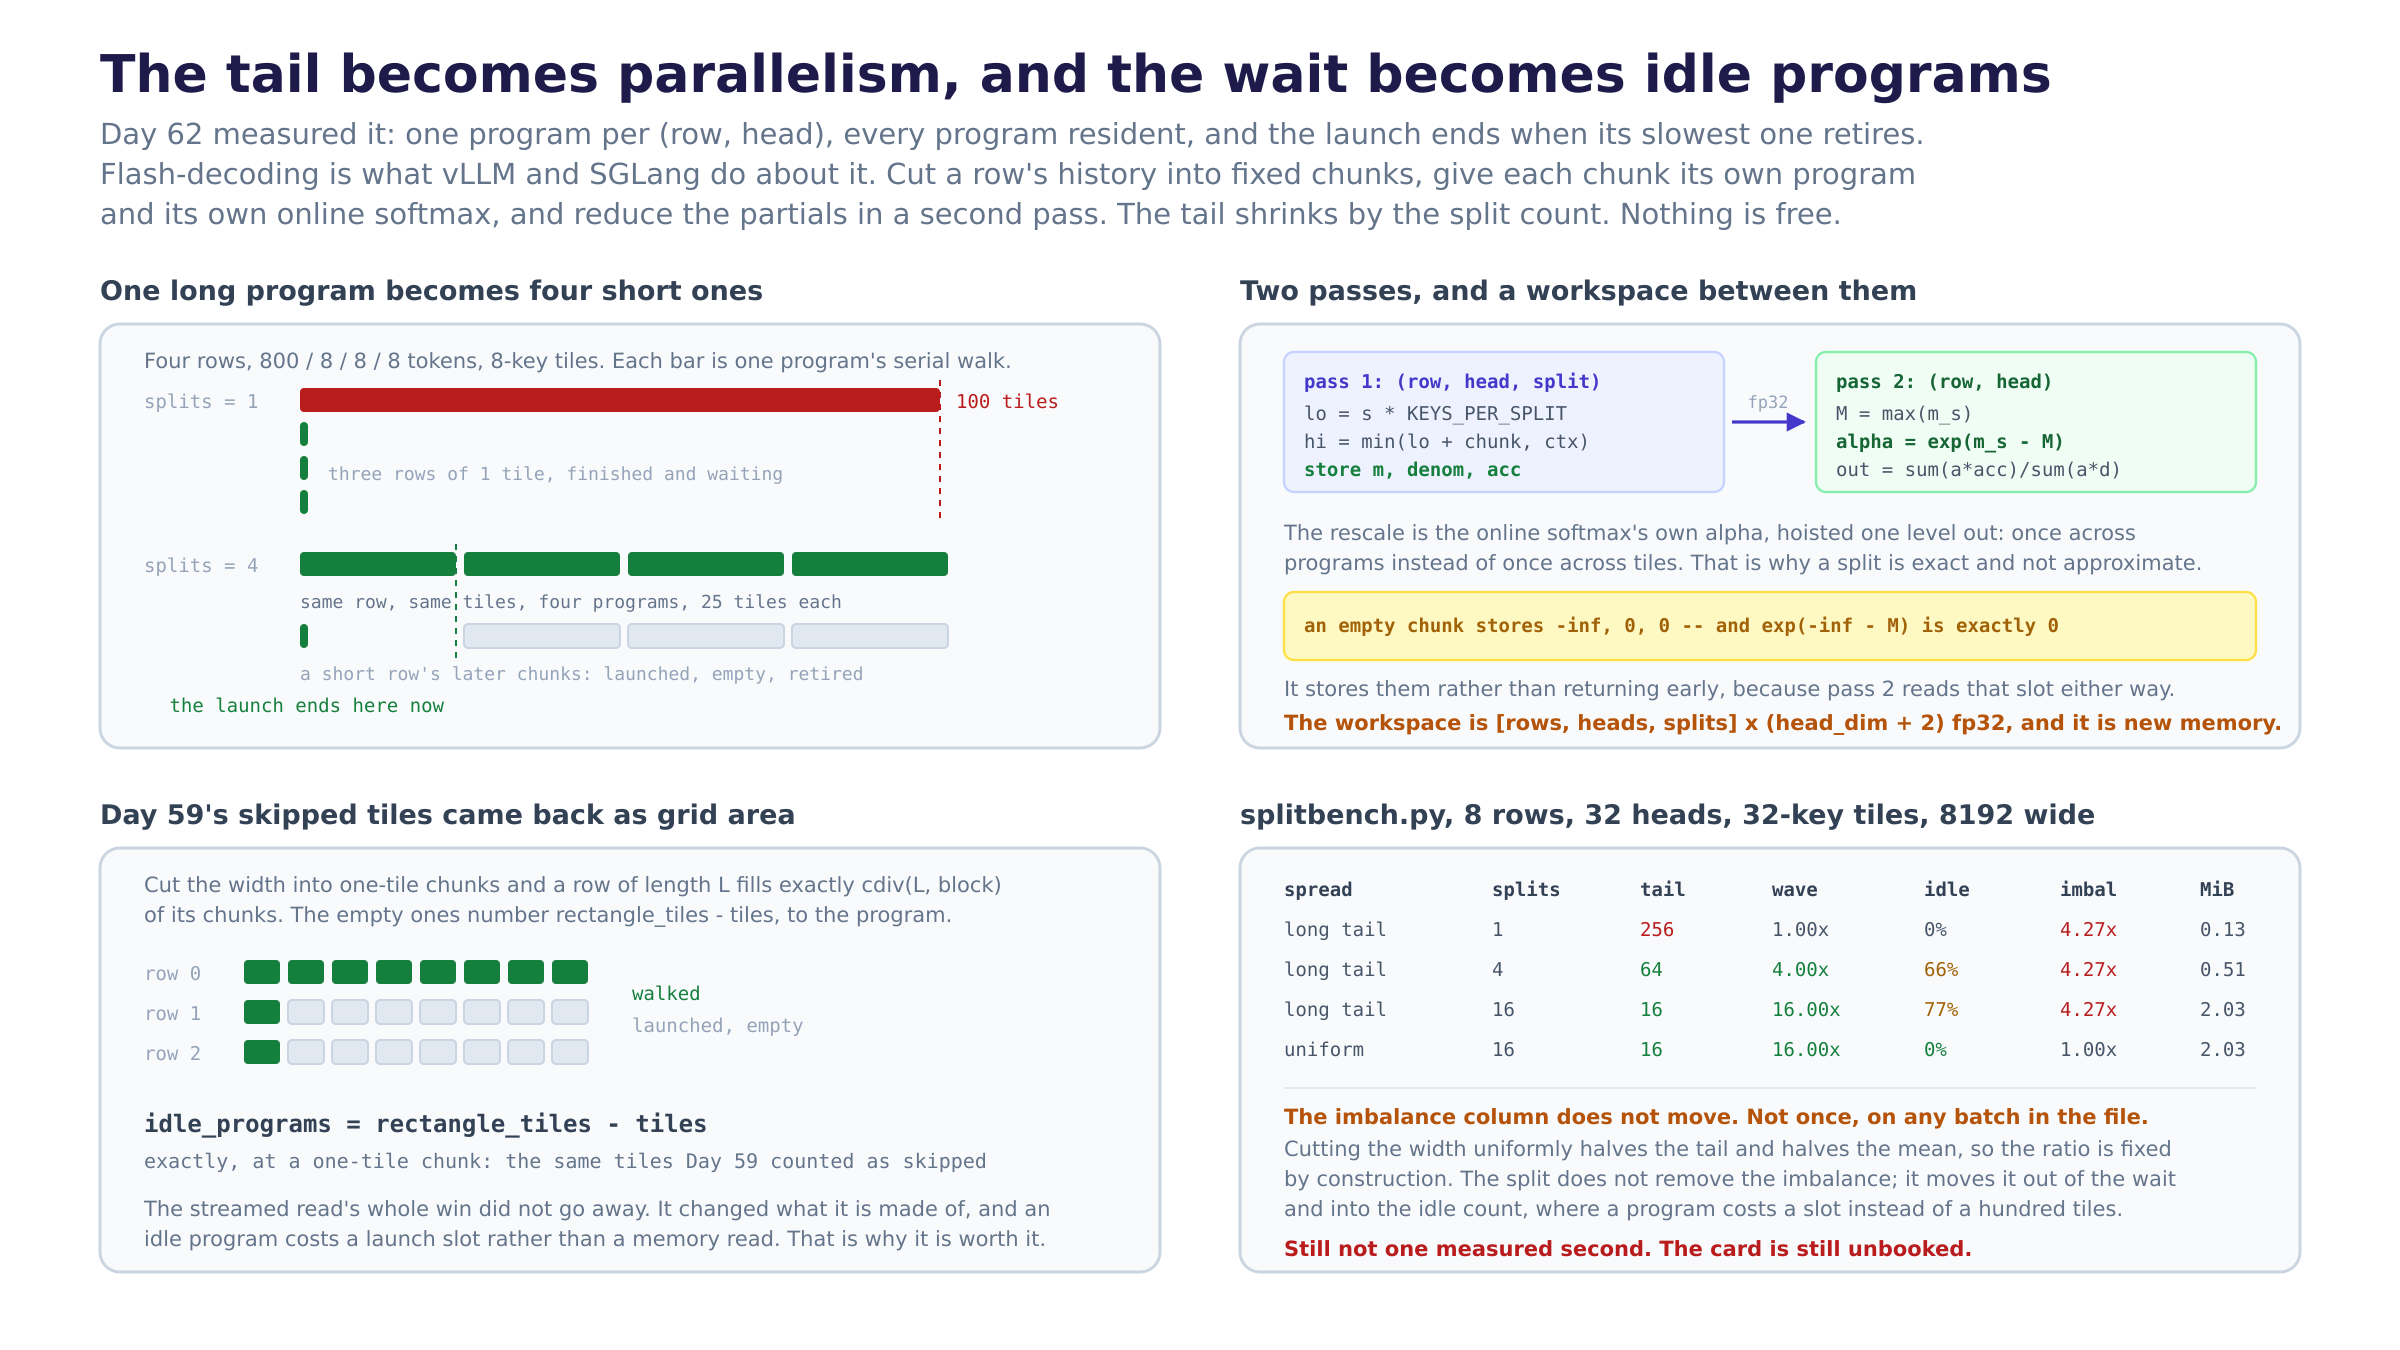
And the number I went looking for did not move. imbal is 4.27x on the long-tail batch at 1 split, and 4.27x at 2, 4, 8 and 16. Not approximately: identically, on every batch in the file. Cutting the width uniformly halves the tail and halves the mean, so the ratio is fixed by construction. The split does not remove the imbalance. It moves it out of the wait and into the idle count, where a program costs a launch slot instead of a hundred tiles of memory traffic, and idle goes 0% to 44% to 66% to 77% as the tail comes down. Both columns are the same fact, and yesterday I only had a name for one of them.
What I learned
- Day 59’s skipped tiles came back as grid area, exactly, to the program. Cut the width into one-tile chunks and a row of length L fills exactly
cdiv(L, block)of its chunks, so the empty ones numberrectangle_tiles - tiles: the same tilesragged_savingcounts as skipped.idle_fractionis1 - 1/work_saving, and there is a test that asserts it as an equality. I expected an approximation and found an identity, and it reframes four days of work: the streamed read’s win never went away, it changed what it is made of. A skipped tile was a memory read not done; an idle program is a launch slot not used. The second is much cheaper, which is the whole reason the trade is worth making, but it is the same quantity. imbalancestopped being the right lens the moment I acted on it. I built that column yesterday as the thing a split would recover, and a split leaves it numerically unchanged. The metric was a ratio of the tail to the mean, and it was a good proxy for wall clock only while every program had work; after a split the mean includes programs that cost nothing, so the ratio holds still while the thing it was proxying for drops by 16x. A measurement that survives the fix it motivated is measuring something adjacent to what you thought.- A program that has nothing to do still has to write. My first instinct was an early return for an empty chunk, and it is wrong for a reason that has nothing to do with performance: the second pass reads that slot whether or not the first pass wrote it, and an unwritten slot of a
torch.emptyworkspace is not zero, it is whatever was there. Storing-inf, 0, 0is both the correct value and the cheaper code, because the alternative is a branch in pass two. - The split count is a memory decision as much as a latency one, and the two scale with the same constant.
partial_bytesisrows * heads * splits * (head_dim + 2)fp32, so the workspace grows linearly in exactly the number the tail shrinks by: 8.12 MiB at 32 rows and 16 splits, against the 268 MB score rectangle Day 59 deleted. Small, but it is the first thing since Day 59 that goes back on the memory side of the ledger, and it is a fresh allocation per call, which a captured region cannot do. choose_splitsis why vLLM ships both kernels instead of replacing one. A 256-row batch is already 8192 programs; the hardware is a queue, a skipped tile really is a skipped wave, and a split there buys a workspace and a second pass for no parallelism. One row at 8192 tokens is 32 programs on a card that holds thousands, and the split is the only thing that fills it. A server moves between those two states minute to minute, which means the choice is per launch and not per build.- fp32 partials are not caution, they are the one place the rescale happens. The accumulators inside a program were always fp32 and the output was cast back at the store. Here a different program multiplies a stored accumulator by
exp(m - M), so the value has to survive a round trip through memory at full range before the rescale, and thehead_dim + 2in the workspace size is that decision costing bytes. - Writing a thing twice found the bug the oracle could not. The chunk bounds exist in three places:
split_plan’s tile counts, the tlsim loop’smin(lo + chunk, ctx), and the jittedtl.minimum. A test that checks the plan against a direct count of the chunks is not redundant with the oracle test, because the oracle test would pass with a plan that describes a launch nobody performs, and the plan is what the bench prints.
Diagram
tail-becomes-parallelism.png. Left top is one long program becoming four short ones, with the short rows’ empty chunks drawn in grey underneath. Right top is the two passes and the workspace between them, with the empty partial picked out. Left bottom is the identity: a one-tile chunk grid, walked against launched, and idle_programs = rectangle_tiles - tiles. Right bottom is the bench, with the imbalance column that refuses to move.
Tomorrow
The split needs the thing it cannot allocate. paged_attention_split_triton calls torch.empty three times per read, and a captured region replays the addresses it was captured with, so Day 64 is giving the partials to the capture plan: price SplitPlan.partial_bytes into Day 54’s workspace_bytes, allocate the three buffers once at the plan’s widest split count, and hand the kernel slices of them the way the decode path already hands it a mapping. That also decides where choose_splits gets called, which is once, at plan time, on the width the bucket set fixed, and never per step. After that the split is wireable to PagedRead as a third mode and the health payload grows a split count next to Day 62’s backend.
The caveat is unchanged and I will not dress it up. Four kernels’ worth of arithmetic is tested, three days of savings are accounted for down to an identity, and not one of them is a second. graphbench.py --weights ./weights --device cuda --rates 1,2,4,8 on both arms is still the first run to book hardware for, and it has been the first thing on that list since Day 58.
Post angle
Day 63 of building an LLM inference engine from scratch. Yesterday I measured the load imbalance in a batched decode read: one program per (row, head), every program resident, and the launch ends when its slowest one retires, so a long-tail batch runs 4.27 times longer than its average program needed. Today is the production answer to that, which is flash-decoding, and it is what vLLM and SGLang do for exactly this reason. Stop making one program own a whole row. Cut the history into fixed chunks, give each chunk its own program with its own running max, denominator and weighted-V sum, and reduce the partials in a second pass, rescaling each one by exp(m_s - M), which is the online softmax’s own alpha hoisted one level out. The tail shrinks by the split count, exactly: 256 tiles to 16 at sixteen splits. Three things I did not expect. First, the split count must come from the mapping’s width and never from the batch’s longest row, because the longest row is a number inside a tensor, so reading it is a host synchronisation and a graph break, and a split count that changes per step is a different grid per step, which is a different captured graph per step. The width is a shape, and after Day 61 it is max_model_len forever, so the split count is a launch constant. Second, a chunk that starts past its row’s end still has to store. My instinct was an early return; it is wrong, because pass two reads that workspace slot whether or not pass one wrote it, and an unwritten slot holds whatever the allocator left. It stores -inf, 0, 0, and exp(-inf - M) is exactly zero, so the empty programs drop out of the reduction with no branch anywhere. Third, and this is the one that reframed the week: the imbalance number did not move. Not approximately, not on any batch in the file. Cutting the width uniformly halves the tail and halves the mean, so the ratio is fixed by construction. What the split actually does is move the spread out of the wait and into the idle count, and at a one-tile chunk the idle programs number exactly rectangle_tiles - tiles, which is the same tiles Day 59 counted as skipped. The streamed read’s whole win never went away. It changed what it is made of, from a memory read not done into a launch slot not used, and the second is much cheaper, which is the entire reason the trade is worth making. 2053 green, and still not one measured second: four kernels’ worth of arithmetic tested against its oracle, and a card still unbooked.