Day 34: the recompute bill, put on the invoice
Date: 2026-08-08 · Week 9 · Phase 3 Batching and scheduler
What I added today
The measurement for yesterday’s policy. Day 33 could evict a running request and rebuild its K/V later, and batchbench had no word for any of that: it counted rows per iteration, so a run that threw a third of its cache away and bought it again looked exactly like a run that scheduled well. IterationOutcome now carries three more things out of a step: the ids the scheduler evicted, the positions the forward computed, and how many of those positions were K/V that had already existed. ContinuousTiming turns those into preempted_at (request id to the iterations it was evicted in), recompute_fraction, preemptions_per_request, and the split that matters most, preempted_latencies_s against straight_through_latencies_s with preemption_latency_penalty as their ratio. The engine grew the counter the denominator needs, prefill_rows, and reports forward_tokens and recompute_fraction itself, so the harness is reading the engine’s own arithmetic rather than a second copy of it. On top is sweep_pool_sizes, which runs one workload through several pools and refuses to hand back the timings unless every pool produced the same text, since a quoted surcharge for a run that generated something else is the price of a bug. Twenty-nine new tests in tests/test_batchbench_preemption.py, the usual two halves: scripted iterations against a fake clock for the arithmetic, then the real engine through shrinking pools for the claim. Suite 457 green (5 GPU-gated skips), ruff clean.
Why it matters
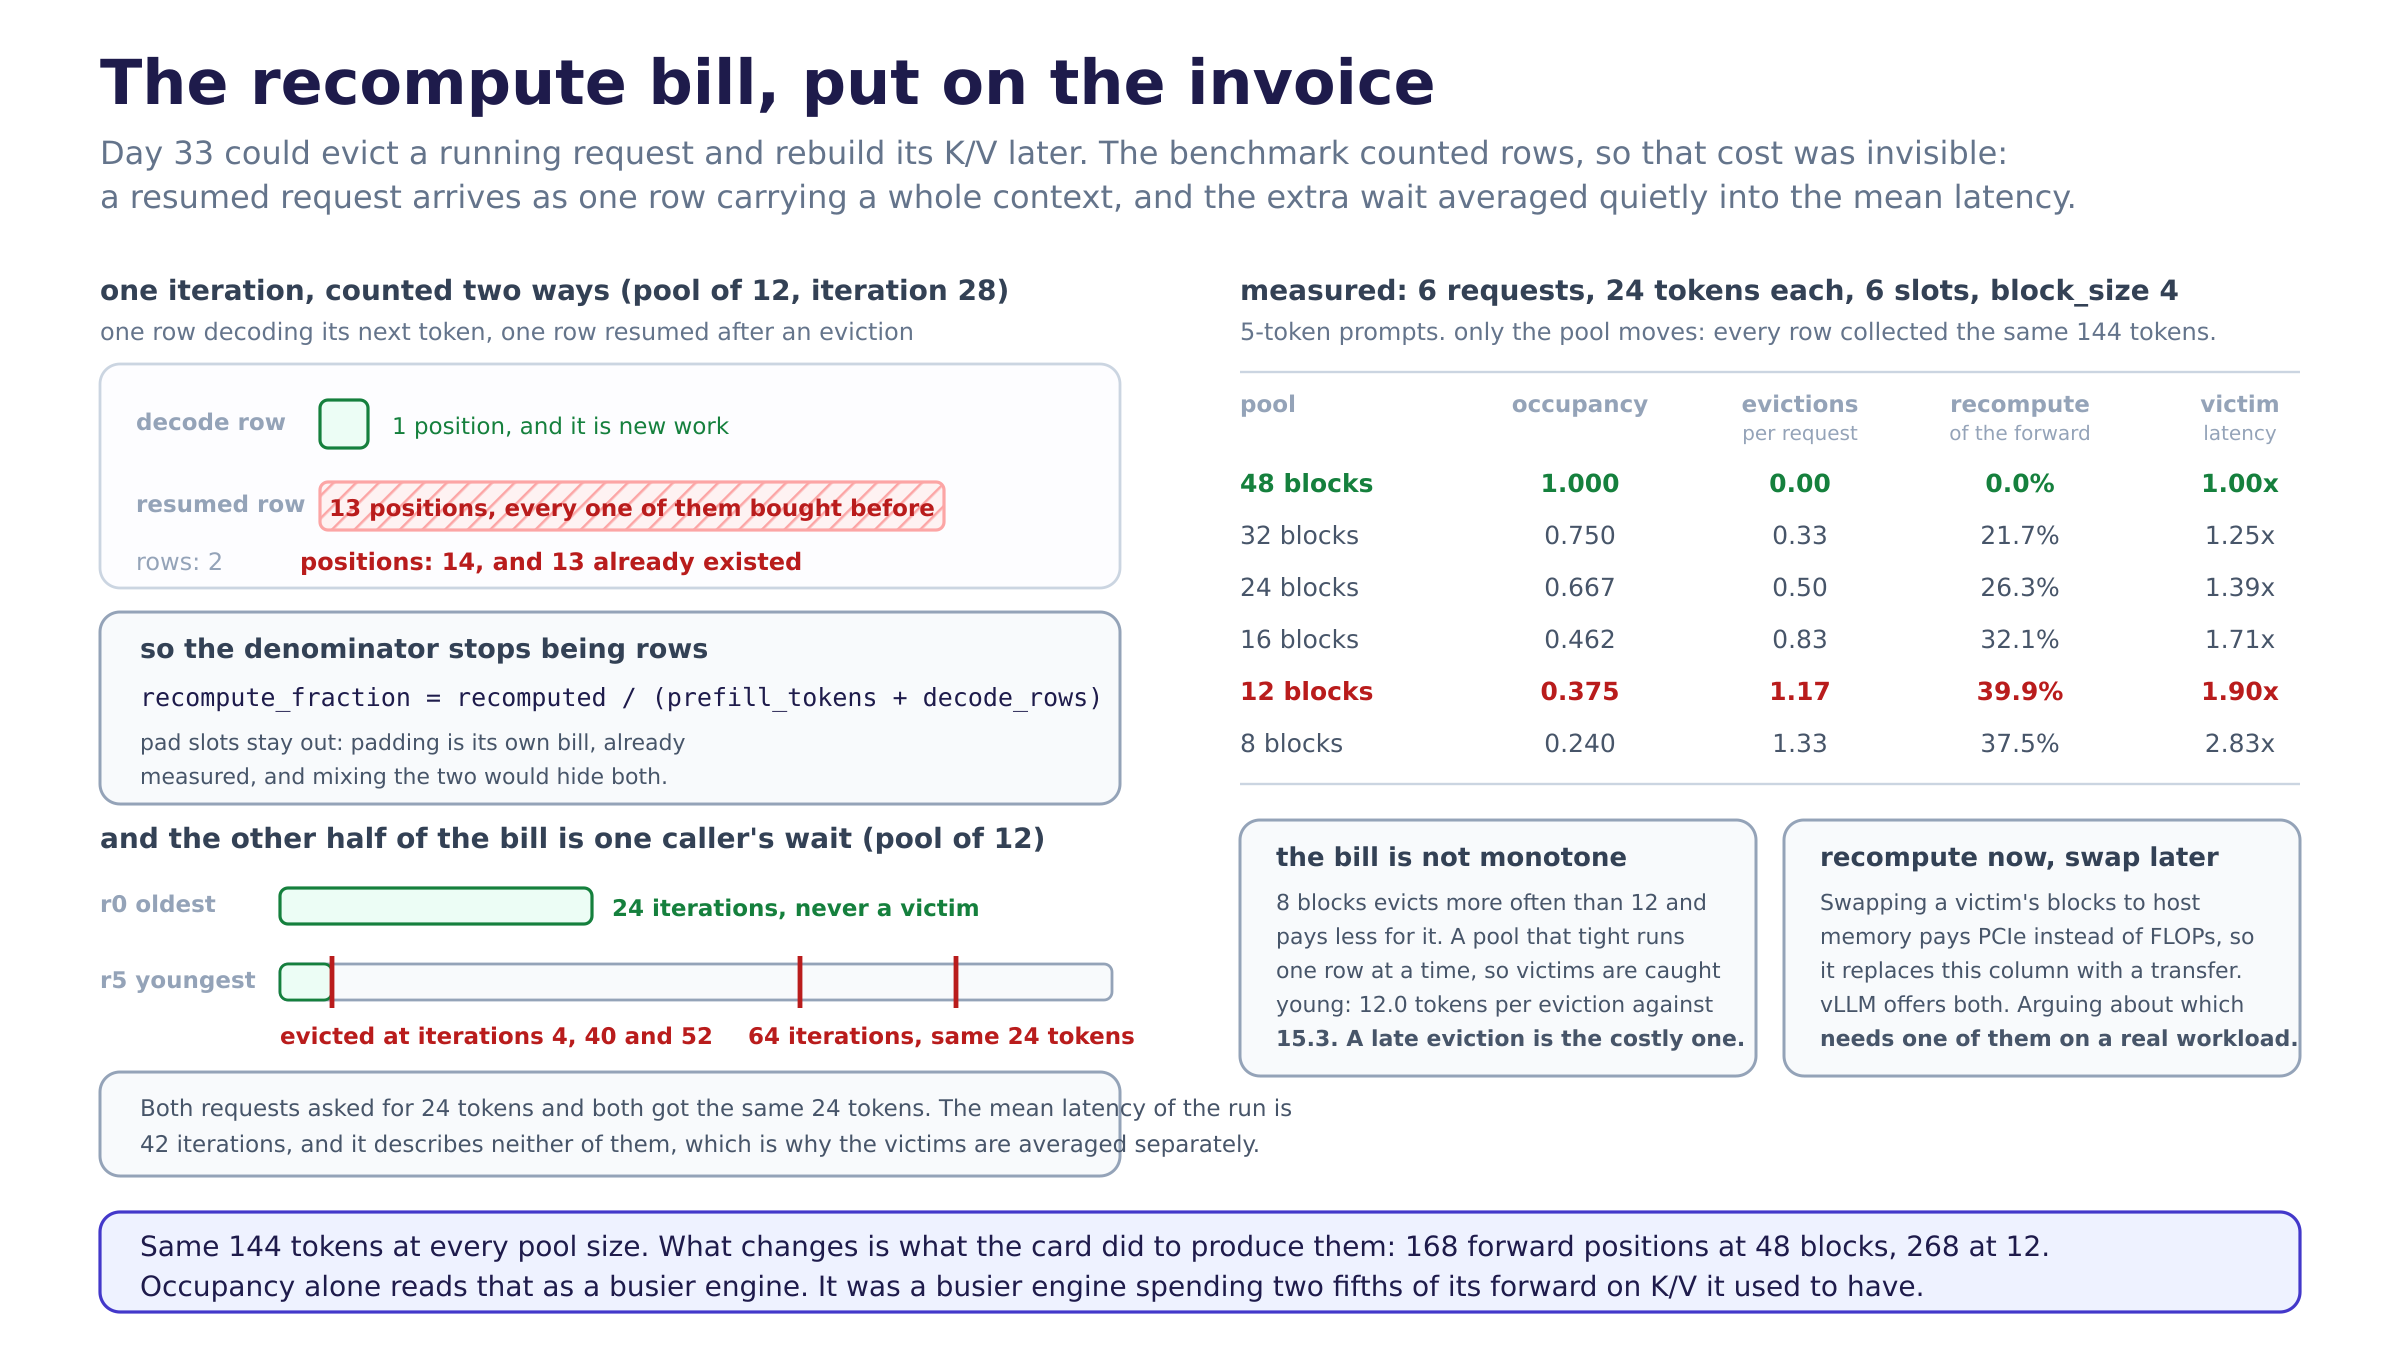
Six requests, 5-token prompts, 24 tokens of budget each, six slots, block_size 4, and only the pool changes:
| pool | occupancy | evictions per request | recompute share of forward | victim latency |
|---|---|---|---|---|
| 48 blocks | 1.000 | 0.00 | 0.0% | 1.00x |
| 32 blocks | 0.750 | 0.33 | 21.7% | 1.25x |
| 24 blocks | 0.667 | 0.50 | 26.3% | 1.39x |
| 16 blocks | 0.462 | 0.83 | 32.1% | 1.71x |
| 12 blocks | 0.375 | 1.17 | 39.9% | 1.90x |
| 8 blocks | 0.240 | 1.33 | 37.5% | 2.83x |
Every row collected the same 144 tokens and the same text. Here is the part that made me write this day: at 48 blocks and at 12 blocks the run issued 144 rows either way, collected 144 tokens either way, and reported waste_fraction 0.0 either way. By yesterday’s numbers those two runs did identical work. Counted in positions they are 168 against 268, and 107 of the cramped run’s positions were K/V it used to have. The bill was always being paid; there was simply no column for it.
The per-request view at 12 blocks is a staircase, and it is the seniority rule showing up as a service level: r0 finishes in 24 iterations and is never a victim, r1 in 28 after one eviction, r2 in 36, r3 in 44, r4 in 56, and r5 is evicted three times and takes 64 iterations for the same 24 tokens. The run’s mean latency is 42 and describes none of them.
The row I did not predict is the last one. Eight blocks evicts more often than twelve (1.33 per request against 1.17) and pays less for it (37.5% against 39.9%), because a pool that tight can only keep one or two rows alive, so victims get caught early: 12.0 tokens per eviction against 15.3. The recompute bill is not a function of how often you preempt, it is the sum of the victims’ lengths at the moment they were picked.
What I learned
- The denominator was the whole bug. Rows are the right unit for the Day-29 decode bill, where every row in a forward computes exactly one token, and they are the wrong unit for anything a prefill does. A resumed request rejoins as one row carrying its entire context, so a recompute of 21 positions and a decode of 1 are the same event to a counter of rows. That is why
issued_tokenscould not tell the two runs apart, and it is a general lesson about benchmarks: the metric that is easiest to collect is the one whose unit was chosen for a different question.forward_tokenscounts positions instead, and it deliberately leaves the pad slots out, because padding is a separate bill this file already reports and folding it in would make the recompute share move with how the prompts happened to line up in a rectangle. - One event, two currencies, and only one of them is felt. The engine pays recompute in FLOPs, spread across everybody, which is what
recompute_fractionreports. The victim pays it in latency, alone, which is what the penalty ratio reports. A single mean latency averages a punished request together with the requests that punished it and produces a number that describes neither, which is exactly what the run at 12 blocks does at 42 iterations. Reporting the two groups separately cost four properties and is the difference between “the engine was busy” and “one caller waited 2.7x as long as the caller ahead of it”. - A latency comparison needs a control group, and mine is contaminated. The penalty divides the victims’ mean latency by the untouched requests’ mean, and victims are the youngest running requests, which under a uniform arrival burst are also the ones that would have finished last anyway. So the ratio overstates the cost of being preempted by however much late admission already cost. I could not think of a way to fix that within one run, and the honest fix is across runs: the same request in two pools, r5 at 24 iterations with 48 blocks and 64 with 12, which is what
sweep_pool_sizesexists to make easy. It is worth writing the contaminated number anyway, with the contamination in the docstring, rather than not measuring the thing at all. - Guard values should say different things when they mean different things. The penalty has two degenerate cases and I wrote them as the same 0.0 first. Nothing preempted means nobody was punished, so the multiplier really is 1.0. Nothing left unpreempted means there is no control group, and the tempting answer, comparing the victims against themselves, produces 1.0 and reads as “preemption was free”, which is the one wrong answer available. Same for the new per-iteration series: an unreported
forward_tokensis charged one position per row, and that is not a placeholder, it is the correct measurement of a decode-only iteration, which is why every Day-32 timing keeps the numbers it had.
Diagram
preemption-measured.png. Left is one real iteration from the 12-block run counted both ways, one decode row of a single position against a resumed row of thirteen that all existed before, then the fraction and what stays out of its denominator, then the two timelines: the oldest request straight through in 24 iterations and the youngest evicted three times and finishing at 64. Right is the pool sweep, with the 12-block row picked out, and the two boxes for the non-monotone surcharge and for why the recompute number has to exist before the swap argument. The banner is the sentence the whole day is about: same 144 tokens at every pool size, 168 forward positions at 48 blocks and 268 at 12.
Tomorrow
The stress test Week 9 still owes: many more requests than slots through a pool small enough to preempt constantly, run long enough that a request is evicted and resumed several times, checking that the text never changes, that no block goes missing from the pool at the end, and that every slot comes back. Today’s harness is what makes that checkable rather than merely survivable, since preempted_at says the pressure was real and sweep_pool_sizes already compares the text across pools. After that the scheduler edge cases that have been accumulating: an abort of a preempted request, a request whose prompt exactly fills a block, and the watermark, which is currently a default nobody has measured. Then Week 9 closes and the engine gets an HTTP server in front of it.
Post angle
Day 34 of building an LLM inference engine from scratch. Yesterday’s engine can evict a running request and rebuild its K/V later. Today I found out my benchmark could not see that at all. Same six requests, same 24 tokens each, once through a 48-block pool and once through a 12-block one. Rows issued: 144 and 144. Tokens collected: 144 and
- Waste fraction: 0.0 and 0.0. By those numbers the two runs did identical work. Counted in positions instead of rows they are 168 and 268, and 107 of the cramped run’s positions were K/V it had already computed once and thrown away. The bug was the unit. A row is exactly one token during decode, which is why row counting works for the Day-29 bill, and a resumed request comes back as one row carrying its whole context, so a 21-token recompute and a 1-token decode are the same event to a counter of rows. The fix is counting positions and leaving pad slots out of it, since padding is a separate bill I already report. The other half of the bill is not paid by the engine at all. At 12 blocks the run’s mean latency is 42 iterations and it describes nobody: the oldest request is never a victim and finishes in 24, and the youngest is evicted three times and takes 64 for the same 24 tokens. So victims are averaged apart from the requests that ran straight through. Two things I got wrong on the way. The control group is contaminated: victims are the youngest running requests, which are also the ones that would have finished last anyway, so the clean comparison is the same request across two pool sizes, not two requests in one run. And the surcharge is not monotone in pressure. An 8-block pool evicts more often than a 12-block one and pays less, because it can only keep one row alive so it catches its victims young, 12.0 tokens per eviction against 15.3. The cost is the sum of the victims’ lengths when you pick them, not the number of times you pick. vLLM and SGLang both offer swapping those blocks to host memory instead, which pays PCIe rather than FLOPs, and I wanted the recompute numbers measured before arguing about which is better. 457 green.