Day 44: the outside baseline, and what a speedup is made of
Date: 2026-08-25 · Week 12 · Phase 5 Benchmark and optimize
What I added today
nanoserve.baseline: RunRecord and SystemRun for one system’s run of one workload, Comparison and compare for a pair of them, RunUnsound and UnfairComparison for the two distinct ways a comparison can be worthless, check_serial and check_concurrent for the two shapes a run has to actually have, and first_divergence for saying where two token streams split. Under that, three runners: run_serial drives any one-at-a-time generator, hf_generate_one builds one over transformers’ model.generate, and run_concurrent submits every prompt to this engine at once and reads Day 43’s stamps back out rather than timing anything itself. hfbench.py at the root drives the sweep and writes day-44-hfbench.csv. tests/test_baseline.py is 51 tests in three tiers: the arithmetic on records placed by hand on a ruler, the gate, and the wiring over the real engine, ending with a weights-gated test that HF generate and this engine emit the same token ids on Llama-3.2-1B. Suite 845 green (5 GPU-gated skips), ruff clean.
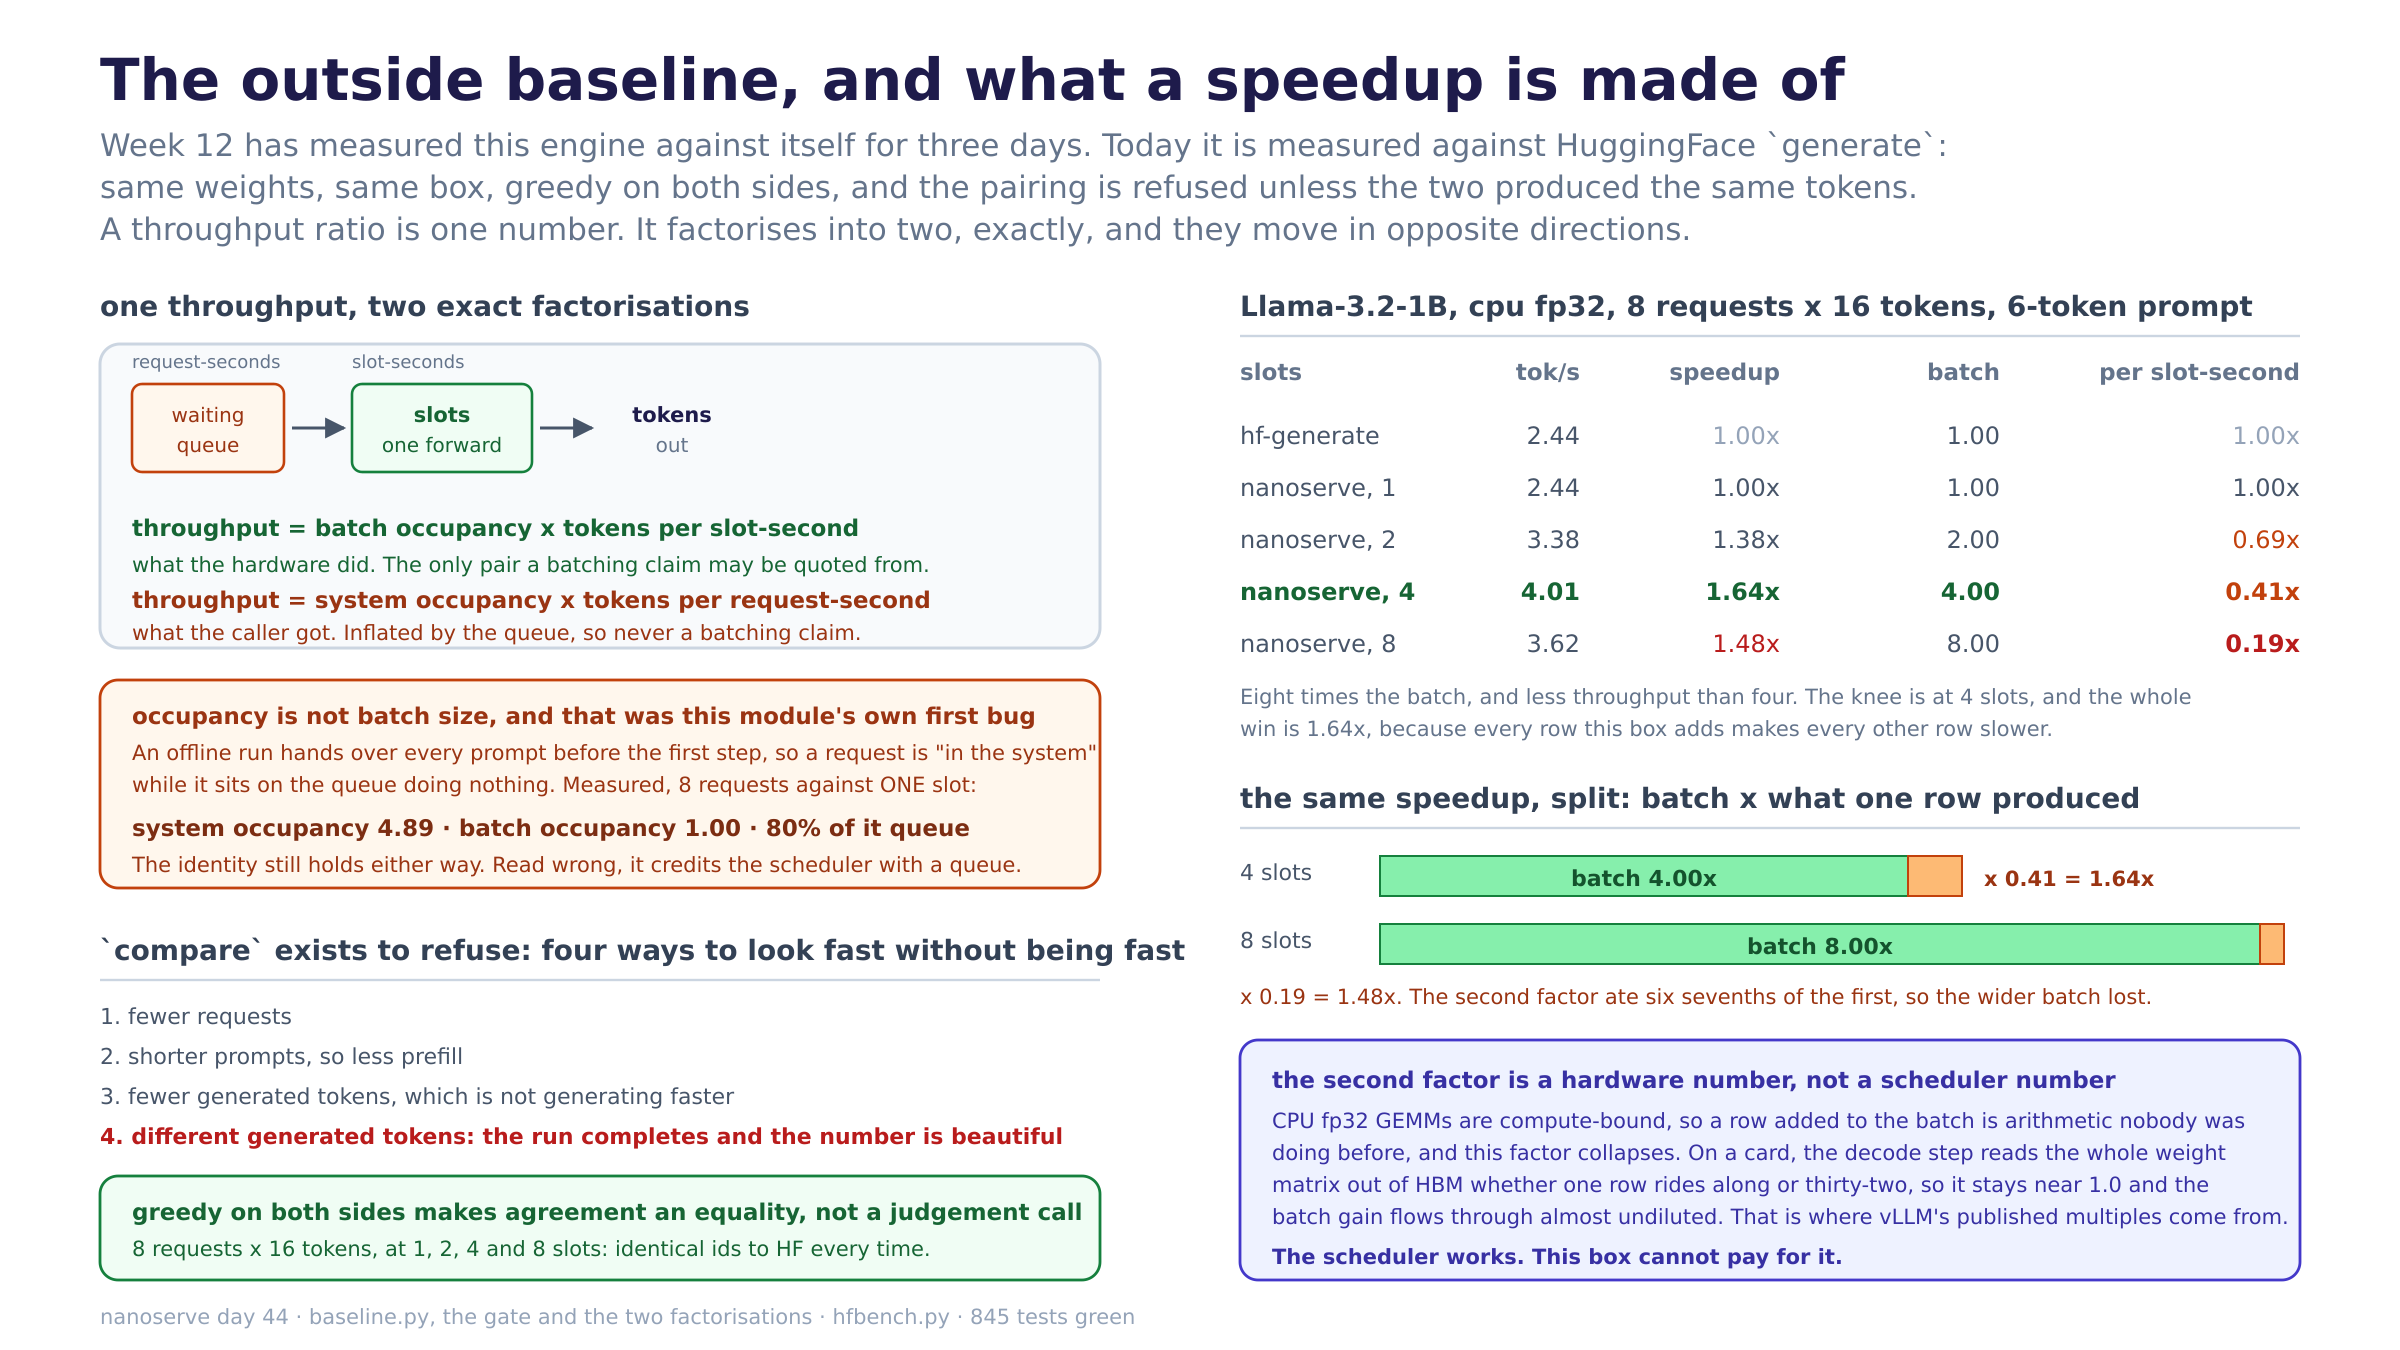
The day is one identity, and it comes in two versions:
throughput = batch occupancy  x tokens per slot-second      (what the box did)
throughput = system occupancy x tokens per request-second    (what the caller got)
Real Llama-3.2-1B, cpu fp32, 8 requests of 16 tokens on a 6-token prompt, greedy on both sides, token ids checked equal at every slot count. One sweep of three; the run-to-run spread is in the last note below, and it is large:
system            tok/s   speedup   batch   per slot-second   queue share
hf-generate        2.44     1.00x    1.00             1.00x            0%
nanoserve, 1       2.44     1.00x    1.00             1.00x           80%
nanoserve, 2       3.38     1.38x    2.00             0.69x           60%
nanoserve, 4       4.01     1.64x    4.00             0.41x           33%
nanoserve, 8       3.62     1.48x    8.00             0.19x            0%
Eight times the batch, and less throughput than four.
Why it matters
A speedup is not a number, it is a product, and only one of the two factors is mine. 1.64x at four slots is 4.00x the batch times 0.41x of what one row used to produce. Those two ask for unrelated work: the first is scheduler and block-pool work, which Weeks 8 through 10 did, and the second is kernel and compile work, which Week 13 has not started. A single ratio cannot say which one you are short of, and quoting it alone is how a serving benchmark ends up being read as a statement about a model’s forward pass. Every row of the table above is batch x per-slot-second and the product is the throughput exactly, so the split is arithmetic rather than attribution.
At one slot this engine and transformers are the same speed, and that is the most useful number here. 2.44 tok/s against 2.44 in the sweep above, and across the three sweeps the single-slot ratio came out 0.88x, 1.00x and 1.26x, straddling 1.0 with a spread that is entirely the baseline’s own noise. With no batching in the picture at all, three weeks of paged attention, a block allocator, a scheduler and a batched sampler have bought nothing measurable over model.generate on one sequence, which is correct and is what I should have predicted: both paths do the same GEMMs in the same framework, and nothing I have written yet changes the arithmetic a forward pass performs. What they bought is the ability to have more than one sequence in flight, which is the other factor, and it is the only factor. Any repo that claims a single-stream speedup over HF without a compiled kernel behind it is measuring something other than what it says.
The knee is at four slots and it goes backwards at eight. 1.64x, then 1.48x. Doubling the batch again multiplied the first factor by two and divided the second by 2.2, so the product fell. Written as what each doubling is worth, over three sweeps whose baselines differed by 1.5x, the marginal numbers came out the same every time:
slots       per slot-second falls by   so throughput x   verdict
1 -> 2                          0.68              1.35   worth it
2 -> 4                          0.59              1.19   worth it
4 -> 8                          0.45              0.90   not worth it
The knee is exactly where the third column crosses 1.0, which makes it arithmetic rather than a shape read off a curve. This is Day 29’s finding arriving from the outside: CPU fp32 GEMMs are compute-bound, so a row added to the batch is arithmetic that was not being done before rather than arithmetic riding along in a memory-bound gap. On a card the decode step reads the whole weight matrix out of HBM whether one row or thirty-two rides along, the second factor stays near 1.0, and the batch gain flows through almost undiluted. That is where the published vLLM and SGLang multiples come from, and it is why the honest way to read this table is “the scheduler works, this box cannot pay for it”.
The gate is the reason any of the numbers above may be printed. compare refuses four things: different request counts, different prompt lengths, different output lengths, and different output tokens. The last one is the one that matters, because the run completes and the number is beautiful either way. Greedy on both sides turns “did they agree” from a judgement call into an exact equality on ids, and all four slot counts agreed with transformers token for token on the real model. A speedup against a system that said something else is not a speedup, and the weights-gated test in test_baseline.py is the version of that claim that runs on every commit where the weights are present.
What I learned
- Occupancy is not batch size, and I wrote the bug before I found it. The first version of this module called
sum(durations)/wall_clock“the mean number in flight” and treated it as the batching factor. Then the one-slot run printed an occupancy of 4.83, which is impossible for a single row, because an offline benchmark hands over all eight prompts before the first step and a request is “in the system” while it sits on the queue doing nothing at all. The identity was never wrong: the queued seconds are in the denominator of the per-request rate and they cancel. The reading was wrong, and read that way it credits the scheduler with having a queue. So a record now carriesserved_s, the seconds it actually held a slot, taken straight from Day 43’srunning_saccumulator, and there are two exact factorisations instead of one. - The sanity check was checking the wrong quantity, and the bug proved it.
check_concurrentwas gating on system occupancy, which on this workload reads 4.83 at one slot: it would have waved through a run with no batching in it and called it validated. It gates onbatch_occupancynow. Day 42 wrotecheck_offered_loadto catch a benchmark that quietly fell back to one request at a time, and it took writing the second one badly to notice that a check is only as good as the quantity it reads. - A
LogitsProcessoris how you time somebody else’s prefill.generateis one opaque call, so the obvious way to get HF’s TTFT is to call it twice, once withmax_new_tokens=1, which times a different computation and doubles the work. A processor is handed the scores of each step as they are produced, so its first invocation is the instant the prompt forward finished and the first token’s distribution existed. It stamps, returns the scores untouched, and the generation being measured is the generation that would have happened anyway. - The baseline’s TTFT is a prefill, and that is what makes it comparable. A system with no queue spends the entire wait for token one inside the prompt forward, so
run_serialrecordsprefill_s = ttft_sdeliberately rather than incidentally. It is what lets the report put HF’s TTFT next to this engine’s prefill (1.09x, 1.05x, 0.99x, 0.74x across the sweep) instead of next to this engine’s TTFT, which at four slots is 10.14s and is mostly the queue Day 43 measured. Comparing a loaded TTFT to an unloaded one is comparing offered loads. - The mean batch came out at exactly the slot count, and that is a result. 1.0000, 2.0000, 4.0001, 8.0002. Every request generates the same 16 tokens here, so rows finish together and there is almost no drain, but it does say the scheduler kept every slot occupied for the whole run rather than leaving one idle waiting for a block. On a ragged workload this number is the one that goes soft first, and it is now measured instead of assumed.
- The baseline is the noisy half, and the marginal numbers are the ones that reproduce. Three sweeps on this box put HF at 2.82, 2.44 and 1.92 tok/s, with its mean prefill wandering from 2.19s to 4.03s, while this engine’s own throughput at each slot count repeated within 3% every time (3.96 / 4.01 / 3.88 at four slots). So the headline speedup inherits all of the baseline’s noise and ranged from 1.41x to 2.02x for the identical code. What did not move at all is the marginal return on each doubling: 0.68, 0.59, 0.45 in all three runs, to two decimals, across a 1.5x spread in the denominator. That is because both sides of a doubling are measured minutes apart on the same machine and the baseline cancels out of the ratio entirely. The lesson for the write-up is to lead with the shape and not with the multiple: “1.64x” is a fact about the afternoon, “each doubling is worth 2 x 0.59 until it is worth 2 x 0.45” is a fact about the box.
Diagram
hf-baseline.png. Left top is the identity and the two ways to factor it. Left middle is the gotcha, occupancy against batch, with the one-slot numbers that exposed it. Left bottom is the four things compare refuses. Right top is the sweep, right middle is the same speedup drawn as batch times what one row produced, and right bottom is why the second factor would look completely different on a card.
Tomorrow
Day 45 closes Week 12 with the graphs the week was for: the latency-versus- throughput curve, drawn from the rate sweep of Day 42 and the slot sweep of today on one pair of axes, so the knee is a point on a picture rather than a row in a table. Then Week 13 starts on the second factor, which is the one this box has been losing on all week: torch.compile on the decode step, then the per-iteration Python overhead, then a profile to find out which of the two was actually the problem.
Post angle
Day 44 of building an LLM inference engine from scratch. Today I finally measured my engine against HuggingFace generate on the same weights, same box, greedy on both sides, and refused to print anything unless the two produced identical token ids. They did, at every batch size. Best result: 1.64x throughput. But the number I actually care about is that a speedup is not a number, it is a product, and only one of the two factors is mine. 1.64x = 4.00x the batch size, times 0.41x of what one row used to produce. Those two ask for completely different work. The first is scheduler and memory, which is the last three weeks. The second is kernels, which is next week. Three things I did not expect. At one slot, my engine and transformers are exactly the same speed: 2.44 tok/s against 2.44. Three weeks of paged attention buys precisely nothing on a single sequence, which is correct, because both paths do the same GEMMs. Going from 4 slots to 8 made it slower, 1.64x down to 1.48x, because on CPU fp32 an extra row is extra arithmetic rather than a free ride in a memory-bound gap. On a card that second factor stays near 1.0, which is the whole reason vLLM’s numbers look the way they do. And I shipped a bug in my own metric: I called mean-requests-in-the-system “batch size”, and the one-slot run printed an occupancy of 4.83 for a single row, because an offline benchmark submits all eight prompts before the first step and a queued request is still in the system. The identity was fine. The reading credited my scheduler with having a queue. Records now carry the seconds they actually held a slot, and there are two exact factorisations instead of one wrong one. 845 green.