Day 62: the decode read became a kernel, and tiles turned out not to be seconds
Date: 2026-09-19 · Week 14 · Phase 5 Benchmark and optimize
What I added today
paged_attention_batched_triton, the module around it, and the dispatch that makes it the thing a live decode step actually calls.
Day 59 wrote the streamed batched read as a grid of tlsim programs. Day 60 put it behind a flag and counted what it held. Day 61 spent the memory it frees and the capture list went from 576 graphs to 9. All three days closed on the same sentence, that the loop is Python and nothing arrived faster, and Day 61 said in as many words that the Triton version is the one thing left before booking hardware is worth it.
src/nanoserve/kernels/triton_batched_attention.py is Day 23’s triton_paged_attention one axis wider, with the same layering for the same reason: every integer the kernel turns into a pointer is ordinary Python in check_batched_inputs / batched_launch_grid / slot_index_dtype, tested on any box, and the @triton.jit body is held to paged_attention_batched_reference by tests gated on a real device. BatchedGeometry carries channels, stride_q_row and max_ctx; check_batched_inputs makes every refusal the oracle makes plus two the oracle gets from torch for free; paged_attention_batched is the dispatcher.
reads.py is the wiring, and it is three lines and one field. STREAMED now calls the dispatcher instead of naming Day 59’s loop, and ReadStats grows backend: "torch" on the rectangle, "triton" or "tlsim" on the streamed read, "" until something has actually run. mode is what the operator asked for and backend is what the box could give them, and those stopped being the same question the moment the flag became a dispatch.
LaunchWork and launch_work are the other half, and they are not about the kernel at all. They are the arithmetic that says how much of Day 59’s ragged_saving a real grid can collect, which is the day’s honest caveat and turned out to be a cleaner statement than I expected.
tests/test_triton_batched_attention.py is 40 tests (7 GPU-gated), test_reads.py gains 9. Suite 1994 green (12 GPU-gated skips), ruff clean. Forty-nine new tests and seven more skips, which is Day 61’s 1952 plus forty-two: the arithmetic is worth checking because seven of today’s tests are the ones that matter most and none of them ran.
gridbench.py, host only, no weights (day-62-gridbench.csv):
the streamed decode read on this box: backend tlsim (32 heads, 32-key tiles)
  uniform    3 rows, widest  3: worst |dispatch - oracle| 2.38e-07
  ragged     4 rows, widest  5: worst |dispatch - oracle| 2.38e-07
  scattered  3 rows, widest  5: worst |dispatch - oracle| 2.38e-07

   rows  width  longest     spread  programs    tiles   tail    work     wave  tight  imbal
      8   8192      512    uniform       256     4096     16  16.00x   16.00x  1.00x  1.00x
      8   8192      512         2x       256     3072     16  21.33x   16.00x  1.00x  1.33x
      8   8192      512         4x       256     1920     16  34.13x   16.00x  1.00x  2.13x
      8   8192      512  long tail       256      960     16  68.27x   16.00x  1.00x  4.27x
      8   8192     4096    uniform       256    32768    128   2.00x    2.00x  1.00x  1.00x
      8   8192     4096  long tail       256     7680    128   8.53x    2.00x  1.00x  4.27x
    256   8192      512    uniform      8192   131072     16  16.00x   16.00x  1.00x  1.00x
    256   8192      512  long tail      8192    30720     16  68.27x   16.00x  1.00x  4.27x
    256   8192     4096    uniform      8192  1048576    128   2.00x    2.00x  1.00x  1.00x
    256   8192     4096  long tail      8192   245760    128   8.53x    2.00x  1.00x  4.27x

  the int32 address ceiling, one layer's pool (2,147,483,648 elements):
   n_kv  head_dim  channels   slot ceiling  fp16 / pool   index
      8       128      1024      2,097,152      4.00 GiB   int32
     32       128      4096        524,288      4.00 GiB   int32
      1       576       576      3,728,270      4.00 GiB   int32
Why it matters
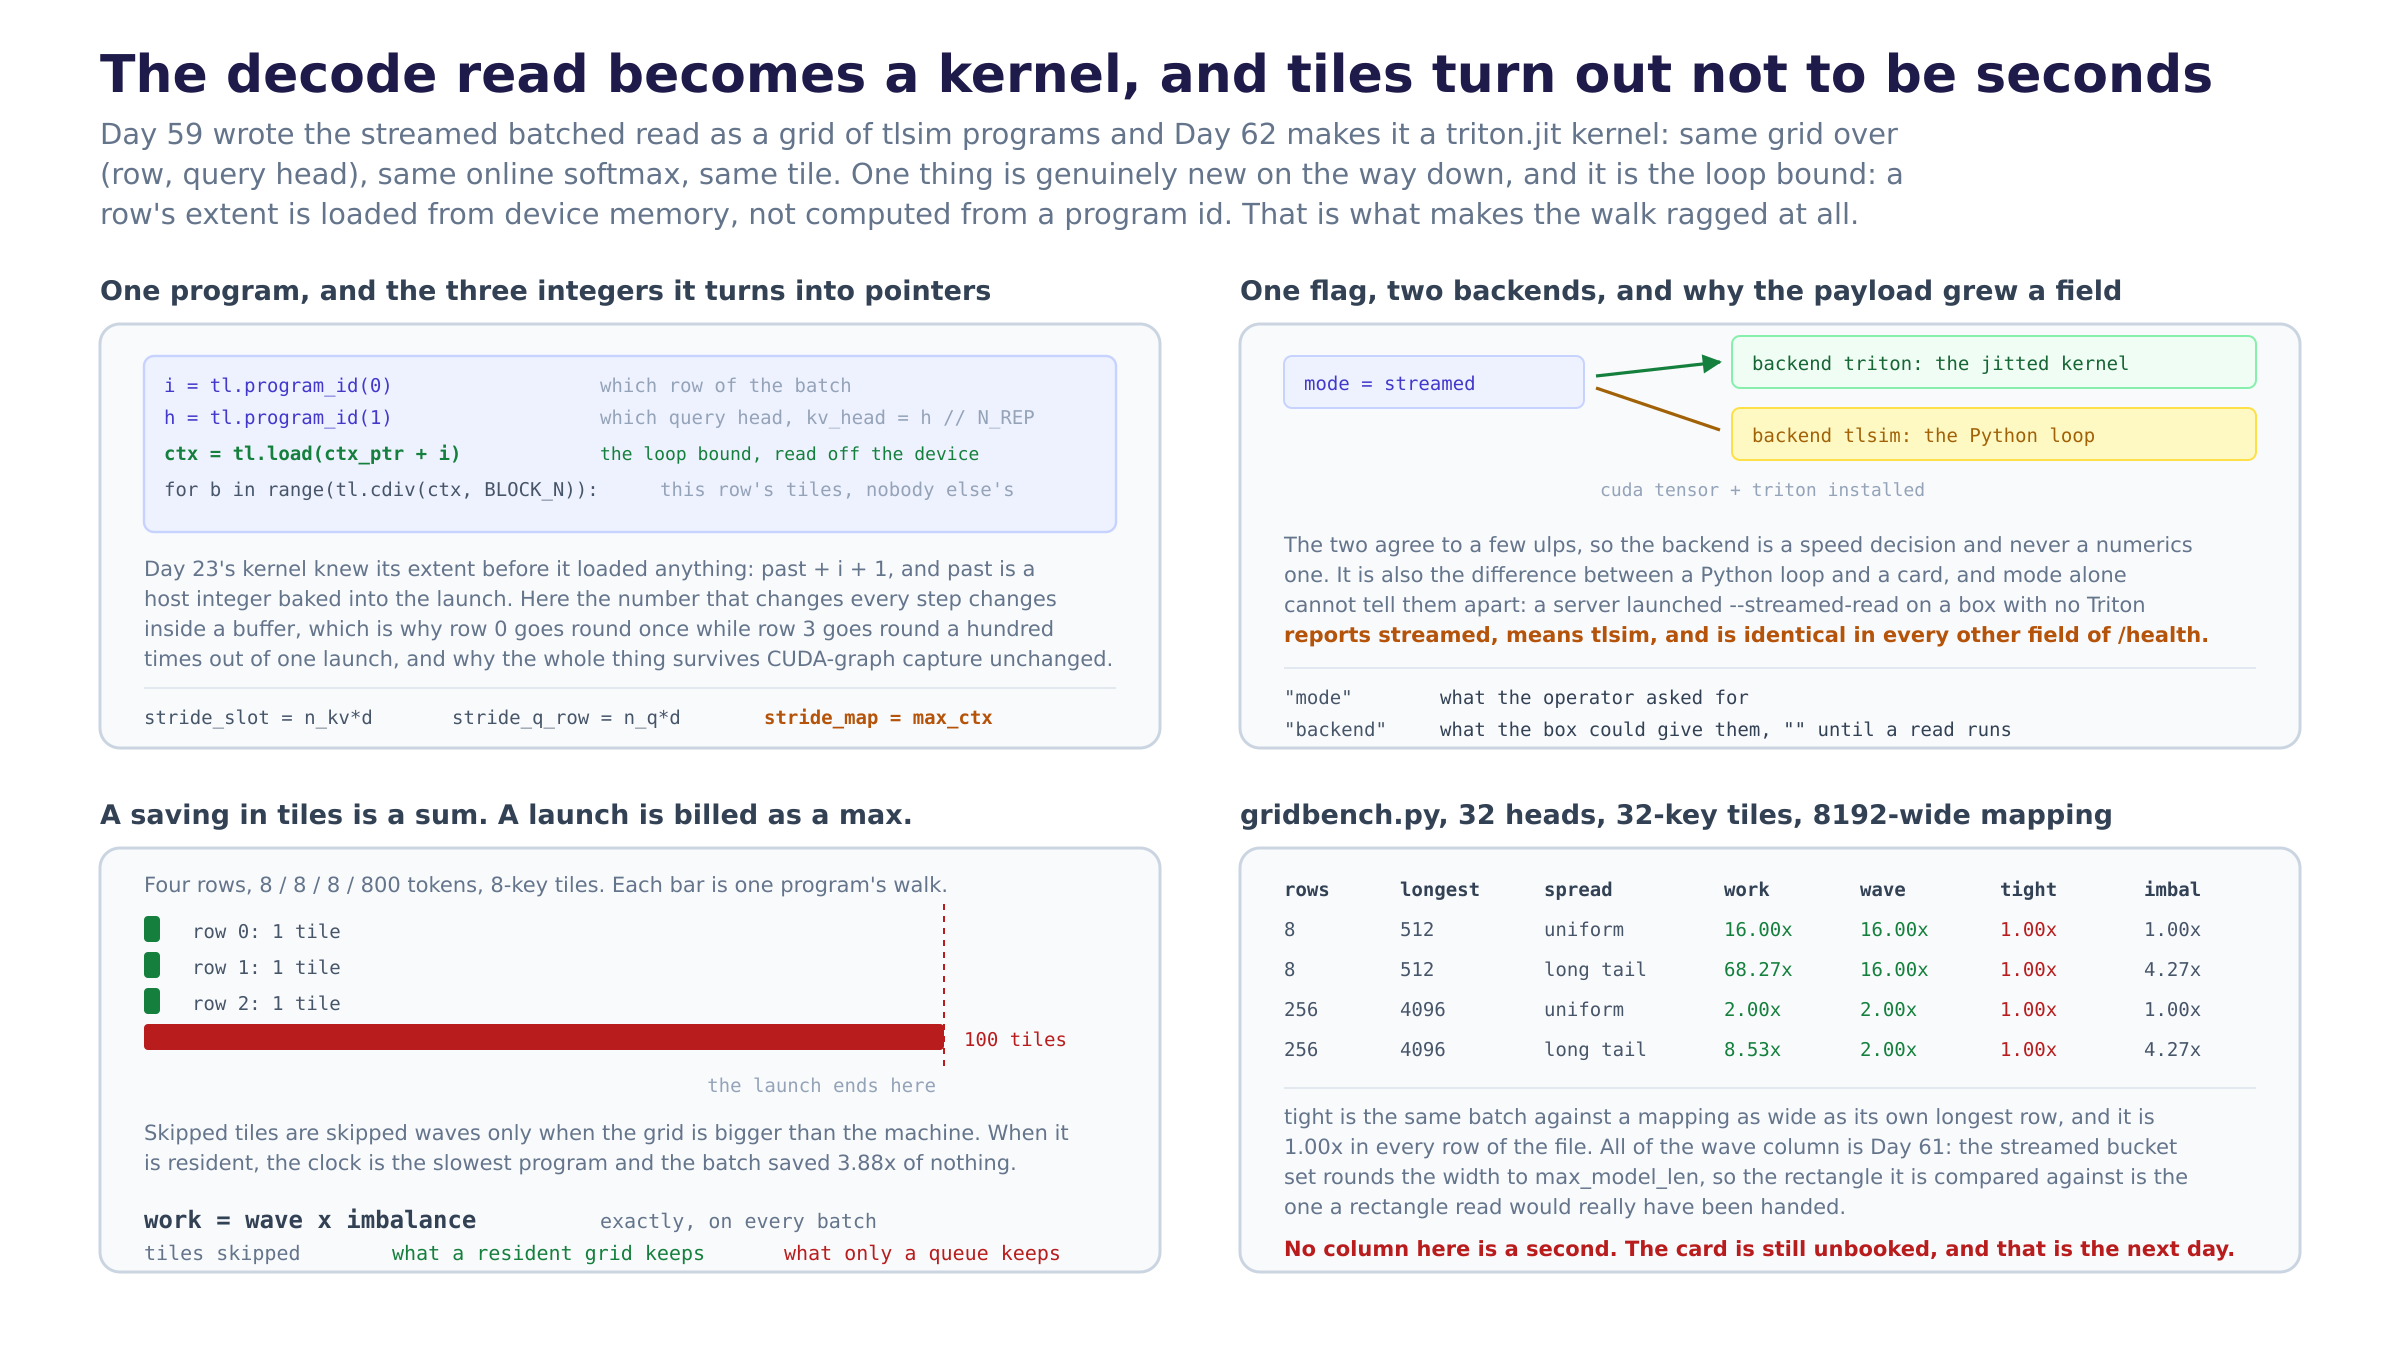
The loop bound is data, and that one line is what the whole day is. Day 23’s kernel knows its extent before it loads anything: query i sees past + i + 1 keys, and past is a host integer baked into the launch. Here the extent is tl.load(ctx_ptr + i), read out of device memory by the program that needs it, because a batch of rows decoding together has one length per row and no program can be told its own from the outside. That is what makes the walk ragged: row 0 goes round once while row 3 goes round a hundred times out of one launch. It is also what makes the kernel safe under everything Days 49 through 58 built. The number that changes every step changes inside a buffer the launcher overwrites, never in a Python range a tracer would bake and never through an int(tensor) the host waits for. A host-side loop bound would be Day 48’s synchronisation and Day 49’s graph break in one expression, and the fact that it is instead a load is why this kernel drops into a captured region with nothing else moving.
max_ctx reaches the kernel exactly once, as a stride, and that is Day 61 stated in pointer arithmetic. The mapping’s row stride is its width, which under a streamed bucket set is max_model_len on every step of every request forever. In the kernel that number is an address multiplier and nothing else: not a loop bound, not an allocation, not a shape, not a tile. Day 61 argued from graph counts that a streamed read does not care how wide a mapping it is handed. This is the same claim with no arithmetic in front of it: base = i * stride_map, and then the program never touches the width again.
work = wave x imbalance, exactly, and I did not know that yesterday. Day 59’s ragged_saving counts tiles a streamed read skips against the tiles a rectangle of the same width implies. A launch is not billed in tiles. Programs are resident until they retire and a batch is finished when its slowest program is, so there are two questions and LaunchWork asks both: work is the sum, rectangle_tiles / tiles, which is what an oversubscribed grid collects because there the hardware is a queue and a tile not walked is a wave not run; wave is the max, cdiv(width, block) / tail_tiles, which is what a fully resident grid collects because there the clock is the longest row. They differ by exactly tail_tiles / mean_tiles, which is the load imbalance, and the three of them multiply out identically on every batch because both savings are cdiv(width, block) / mean once the tail cancels. The imbal column of the bench is therefore not a side note. It is the factor separating the number I have been quoting for three days from the number a resident card would see.
And the corollary is the uncomfortable half. On a mapping as wide as its own longest row, wave is exactly 1.00x and the whole saving is the imbalance. The tight column of the bench is that, computed for every row of the file, and it is 1.00x in all 24 of them. A ragged read on a resident grid saves a great deal of memory and no time at all, and the tiles it skips are numerically the same tiles the tail still makes it wait for. What rescues it is Day 61: the streamed bucket set rounds the width up to max_model_len, so the rectangle the read is compared against is the 8192-wide one a rectangle read really would have been handed, and 16.00x of wave appears out of two days that looked independent. Two days ago the bucket set was a fix for a compile bill. It is also where the latency is.
mode stopped being enough the moment the flag became a dispatch, which is Day 60’s argument applied to Day 60’s answer. That day’s whole subject was that a streamed server and a rectangle server are indistinguishable from outside unless the process publishes a counter. Now there are three states, not two, and two of them share a mode: a server launched with the streamed read on a box with no Triton reports streamed, means tlsim, and matches the kernel in every other field of /health. So the payload names both. "" is a state and not a missing value: it means no read has run, which is a real thing to be told about a process that has been up for an hour.
The address width is a guard against a wrong answer, not against a crash. The kernel forms slot * channels + kv_head * head_dim + d, and Triton takes an offset’s type from the types it was built out of, so an int32 slot index makes that an int32 multiply. Past INT32_MAX it wraps to a negative offset, which is a perfectly legal offset into whatever is in front of the pool, under a mask that says the lane is valid. Nothing faults; a key comes back and the softmax over it is finite. slot_index_dtype compares num_slots * channels against the ceiling and widens, and the honest note is in the third table: the ceiling is on elements, so in bytes it is 4 GiB of one pool at fp16 for every head geometry, and this repo allocates one pool per layer, so it is not reachable on hardware that exists. I kept it because it is a property of the geometry rather than of this box, and because it costs one comparison at launch.
What I learned
- The saving I have been quoting since Day 59 is numerically identical to the load imbalance that stops a card collecting it, whenever the mapping is tight. That is not a near-coincidence, it is
rect_tiles = programs * tailandtiles = programs * mean, sowork = tail / mean = imbalance. I had been readingragged_savingas a property of the read and it is a property of the spread, and the spread is also the thing that makes one program outlast the others. The number was always saying both; I was only reading one side of it. - A dynamic loop bound is the design, and the CPU model made it look like a detail. In
tlsimthe line isctx = int(load(len_buf, arange(i, i + 1))[0]), which reads like bookkeeping: pull a Python int out of a tensor and use it. Writing it astl.loadis what made me notice that it is the only reason this is one launch instead of one launch per length bucket, and the only reason it composes with the captured region. A model that makes the hard thing look easy is doing its job and hiding its own lesson. - Two days that look independent multiplied. Day 61 collapsed the width axis to make the capture list short and the arena small, and I wrote it up entirely as a memory and startup day, ending on “nothing here made a single token arrive faster”. Today the same rounding is the entire reason
wave_savingis not 1.00x. Thetightcolumn exists so that is visible rather than assumed, and it is the column I would have left out a week ago. - The int32 ceiling is a byte ceiling, not a token ceiling. I built the table expecting the head geometry to matter, since a wide latent addresses fewer slots than a narrow one. It does not: the limit is on elements, so the bytes at the ceiling are
2**31 * itemsizefor every row of the table, 4 GiB of one pool at fp16. Three geometries, three different slot counts, one number. That is the sort of thing that is obvious after it is written down and was not before. - The guards worth adding to a kernel are the ones its oracle gets from torch for free.
check_batched_inputsrefuses a head_dim that disagrees with the pool and ann_repthat does not tile the query heads. The oracle refuses neither, because it dies in a matmul with torch’s own message. A kernel does not have a matmul. It hasslot * channels + kv_head * head_dim, which is two plausible numbers producing a real key belonging to another head. The asymmetry is the whole reason the host half of this module exists. - Recording the backend after the call rather than at construction is the same discipline as charging the counters after the call, and I nearly got it wrong. A
PagedReadis built before any tensor has been moved anywhere, so a backend stored at construction is a guess about a device that does not exist yet, and it would go stale the moment an engine is moved to a card. Askingq.deviceper call is a string compare, and putting the assignment below the read means a refused call leaves the field empty, which is what “nothing has run” should look like. - Nothing here made a token arrive faster either, and this is the third day in a row I have had to write that sentence. The difference is what it is waiting on. Day 59 was waiting on wiring, Day 61 was waiting on a kernel, and this is waiting on a card, which is not a commit.
Diagram
batched-read-becomes-a-kernel.png. Left top is one program and the three integers it turns into pointers, with the loaded loop bound picked out. Right top is the dispatch and why the payload grew a field. Left bottom is the sum against the max, four programs of 1, 1, 1 and 100 tiles, and the identity they factor into. Right bottom is the bench with the tight column next to the wave one.
Tomorrow
The imbalance column is now a measured thing and there is a known answer to it. Day 63 is the split: partition one row’s history across several programs, have each keep its own partial max, denominator and accumulator, and reduce the partials in a second pass, which is flash-decoding and is what vLLM and SGLang do for exactly this reason. It turns the tail into more parallelism instead of a longer wait, and it is the first thing since Day 59 that gives memory back, because the partials are a real [rows, heads, splits] workspace the capture plan will have to price. The partition arithmetic, the reduction, and the refusal when a split count does not divide a tile are all host-side and testable here; the jitted body is gated like today’s.
The caveat is smaller in scope than it has been and I want to be exact about it. The kernel is written, its addressing is tested, its refusals match its oracle, and the only thing between this streak and a latency number is a box with a GPU in it. graphbench.py --weights ./weights --device cuda --rates 1,2,4,8 on both arms, with ReadStats.backend reading triton, is the first run to book hardware for, and it has been the first thing on that list since Day 58.
Post angle
Day 62 of building an LLM inference engine from scratch. The batched decode read is a real Triton kernel now, and the line that made it one is the loop bound. Day 23’s single-sequence kernel knows how far to walk before it loads anything: query i sees past + i + 1 keys and past is a host integer baked into the launch. A batch does not work like that. Each row has its own history length, so the program has to tl.load(ctx_ptr + i) and use what comes back as its range. That is the ragged walk, and out of one launch row 0 goes round once while row 3 goes round a hundred times. It is also the reason the thing survives CUDA-graph capture: the number that changes every step changes inside a buffer, not in a Python loop a tracer bakes and not through an int(tensor) the host waits on, which is the synchronisation Day 48 found and the graph break Day 49 spent a day removing. Then the thing I did not expect. I have been quoting a “ragged saving” since Day 59, tiles a streamed read skips against the tiles a rectangle implies. A launch is not billed in tiles. Every program is resident until it retires, so the batch ends when its slowest program does, and there are two savings: the sum, which an oversubscribed grid collects because there the card is a queue, and the max, which is all a fully resident grid gets. They factor exactly: work = wave x imbalance, where imbalance is the longest program over the average one. And on a mapping as wide as its own longest row the wave saving is exactly 1.00x, so the entire saving is the imbalance, and the tiles skipped are numerically the tiles the tail still makes you wait for. What rescues it is the day before. Day 61 rounds every mapping up to max_model_len so the capture list can lose its width axis, and that rounding is the only reason the wave saving is 16x instead of 1x: the rectangle you are compared against is the wide one a rectangle read would really have been handed. Two days that looked independent multiply. The production answer to the leftover imbalance is flash-decoding, splitting one long row across programs and reducing the partial softmaxes, which is what vLLM and SGLang do and which is tomorrow. One more thing that shipped today: the read’s health payload now names its backend, not just its mode, because a server launched --streamed-read on a box with no Triton reports streamed, means the Python model, and is identical to the kernel in every other field. 1994 green, and still not one measured second: the kernel is written and tested against its oracle and the only thing left is a box with a GPU in it.